Over the last decade, US lawmakers have embraced a more muscular industrial policy aimed at reshoring manufacturing in strategic industries like energy and semiconductors.
After the Trump administration’s latest round of tariffs, which at press time included a baseline 10 percent import tax on all countries, some executives are asking afresh whether relocating production to the US could deliver more business value.
Companies need a strategic geographic perspective to navigate the complex trade-offs and opportunities of supply chain transformation. Global manufacturers already leverage geographic information system (GIS) technology as the foundation for supply chain analysis and decision-making.
For companies planning to boost US production, GIS smart maps are indispensable in assessing sites for potential factories and distribution centers, with integrated views of variables like labor pools, utilities, zoning, and land availability.
For firms hitting pause on major decisions until the picture on global trade clears, GIS dashboards can help leaders game-plan scenarios or identify parts of their supply operations that could be reshored with the least amount of risk and disruption.
Supply Chain Analysis: What Would a Reshoring Renaissance Look Like?
In an age of automation and robotics, relocating manufacturing facilities is a complex process, costly in both time and capital. Building a new biopharmaceutical plant, for instance, can require five to 10 years and $2 billion.
At the same time, economic data suggests that previous tariffs and legislation like the Inflation Reduction Act have at least partly succeeded in strengthening industries of strategic national value. For example, America’s solar manufacturing capacity jumped from 14th in the world in 2017 to its current rank of 3rd—a boost to energy independence and national resilience.
For a solar panel maker or a pharmaceutical company with a foreign supply base, domestic incentives could make reshoring a possibility. Supply chain analysis can provide a plan.
A CEO mulling construction of a solar-panel factory or a biopharma plant, for instance, would first need to evaluate access to raw materials, real estate, and skilled labor to staff the facility. A GIS analyst could identify real estate parcels in key markets that meet conditions for acreage, workforce, raw materials, grid access, and tax incentives.
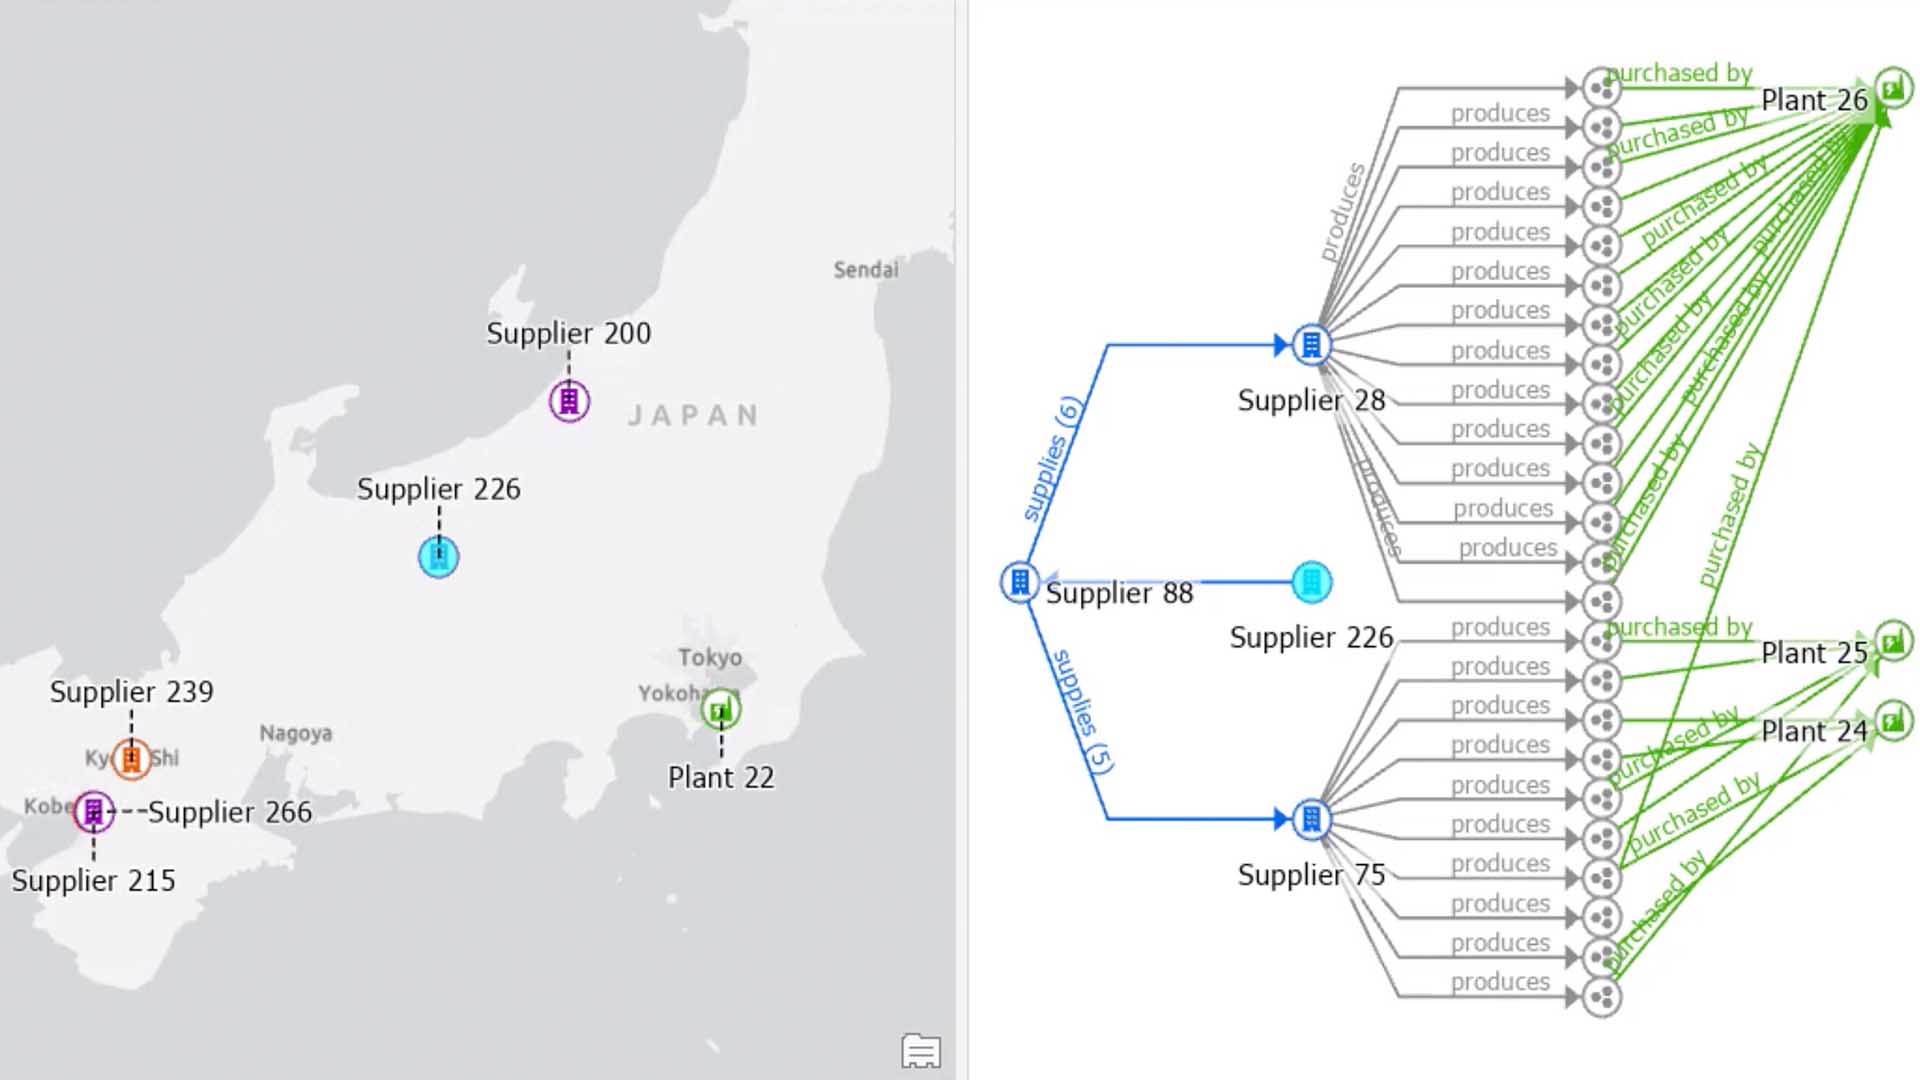
To scenario plan a US supply network for a new facility, a CEO could toggle on a map layer highlighting domestic suppliers of upstream components like batteries, mounting systems, and packaging.
By the same token, using GIS to analyze gaps in the domestic supply chain—regions that lack producers of silicon ingots, wafers, or coating agents, for example—could help executives determine where they still need to outsource production to global partners.
Grading Supply Operations by Cost and Location
The Kearney Reshoring Index regularly surveys CEOs about the top business case for reshoring or nearshoring their manufacturing footprint.
In 2024, 63 percent cited increased sales, 59 percent selected improved total landed cost (costs associated with moving products from factory to customer), and 58 percent named improved fill rates (the amount of orders that can be fulfilled based on existing inventory).
Location analytics can help manufacturing decision-makers simulate the financial burdens and benefits of reshoring parts of their supply chain.
For instance, a toolmaker headquartered in Ohio might consider whether to work with suppliers in Shenzhen, China; Louisville, Kentucky; or Jalisco, Mexico. A GIS map could display the shipping distances for each partner and reveal freight costs, delivery times, and a risk index for each route.
Finding Signals in the Haze of a Trade War
Business leaders have experienced a bevy of supply chain tremors in the past decade, from the COVID pandemic to natural disasters to geopolitical shifts.
With location intelligence for supply chain analysis, firms can simulate alternative scenarios, anticipate market shifts, and model resilient supply chains that effectively outmaneuver uncertainties, delivering for both customers and the bottom line.
The Esri Brief
Trending insights from WhereNext and other leading publicationsTrending articles

December 5, 2024 |

June 23, 2026 |

March 3, 2026 |

March 17, 2026 |

April 7, 2026 |

June 2, 2026 |