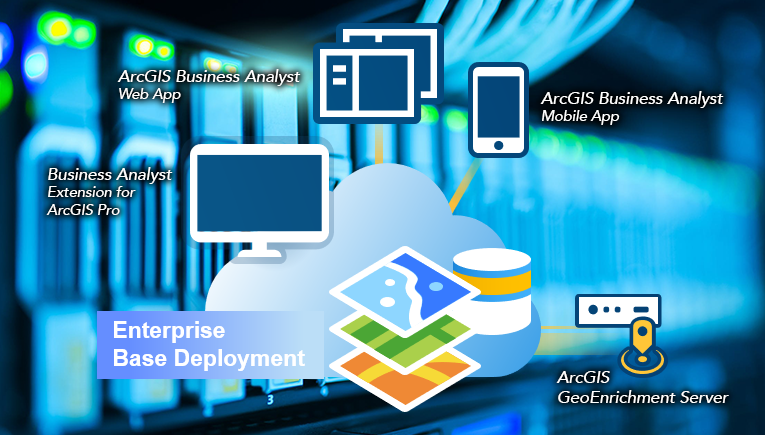
The 10.7 release brings a major update to ArcGIS Business Analyst services and content. After much consideration, discussions with our distributors and partners, and feedback from users, we’ve renamed the solution to ArcGIS Business Analyst Enterprise. This includes the new ArcGIS GeoEnrichment Server for performing data enrichment, creating reports and infographics, and running other analysis.
Here are the key highlights of this release:
ArcGIS GeoEnrichment Server
The ArcGIS GeoEnrichment Server is the next-generation of server software, which gives users a significant boost in performance and a demographic database for mapping and data enrichment.
Here’s a quick timeline:
- 2013: First generation of GeoEnrichment released in ArcGIS Online.
- 2016: GeoEnrichment capabilities and the Business Analyst Web App included on-premises with the 10.5 release with Business Analyst Server and ArcGIS Enterprise.
- 2017: Modernized GeoEnrichment server architecture introduced to ArcGIS Online, improving performance and stability while introducing a central database of demographic content.
- 2019: Updated GeoEnrichment Server architecture released with ArcGIS Business Analyst Enterprise.
You may be asking, “What’s happening to Business Analyst Server?” With this release, the original Business Analyst Server software has been deprecated, but will still be available to existing Business Analyst Server solution customers upon request. Check out our topic on migration scenarios for more information.
Improved Performance
Your time is valuable. We’re all short on time and busier than ever. That’s why we’ve worked to make Business Analyst faster than it has ever been before. Business Analyst Enterprise offers an enhanced ability to process large requests at much faster response times. The team performed internal benchmarking tests for this release and found a reduction in response time by roughly 80% when enriching 100 features simultaneously to as much as 99% when enriching a single feature.
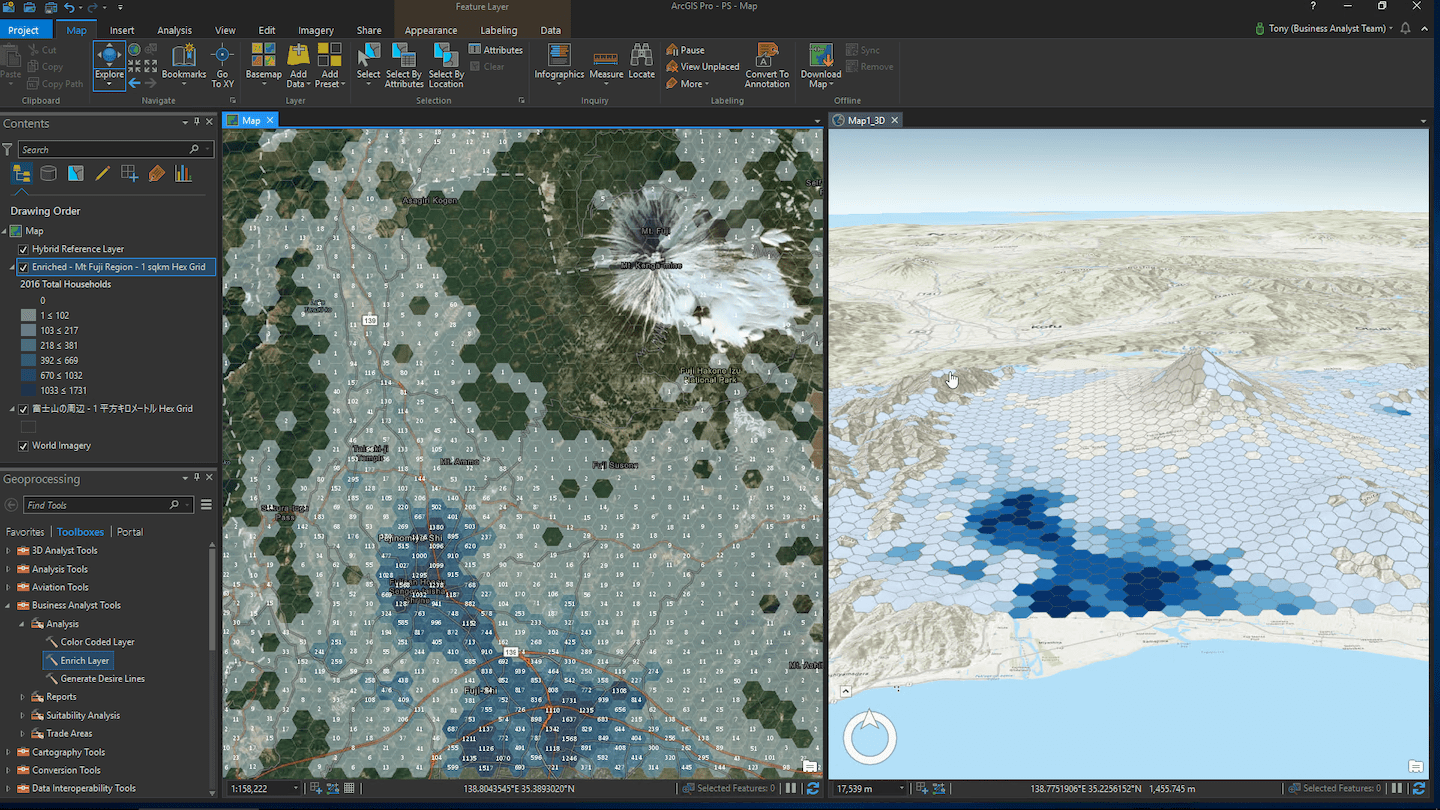
Your other applications that use GeoEnrichment will process and respond faster too! These include the ArcGIS Business Analyst Web App, ArcGIS Maps for Office, and even analysis tools like Enrich Layer in ArcGIS Pro or ArcGIS Online.
Demographic Feature Services
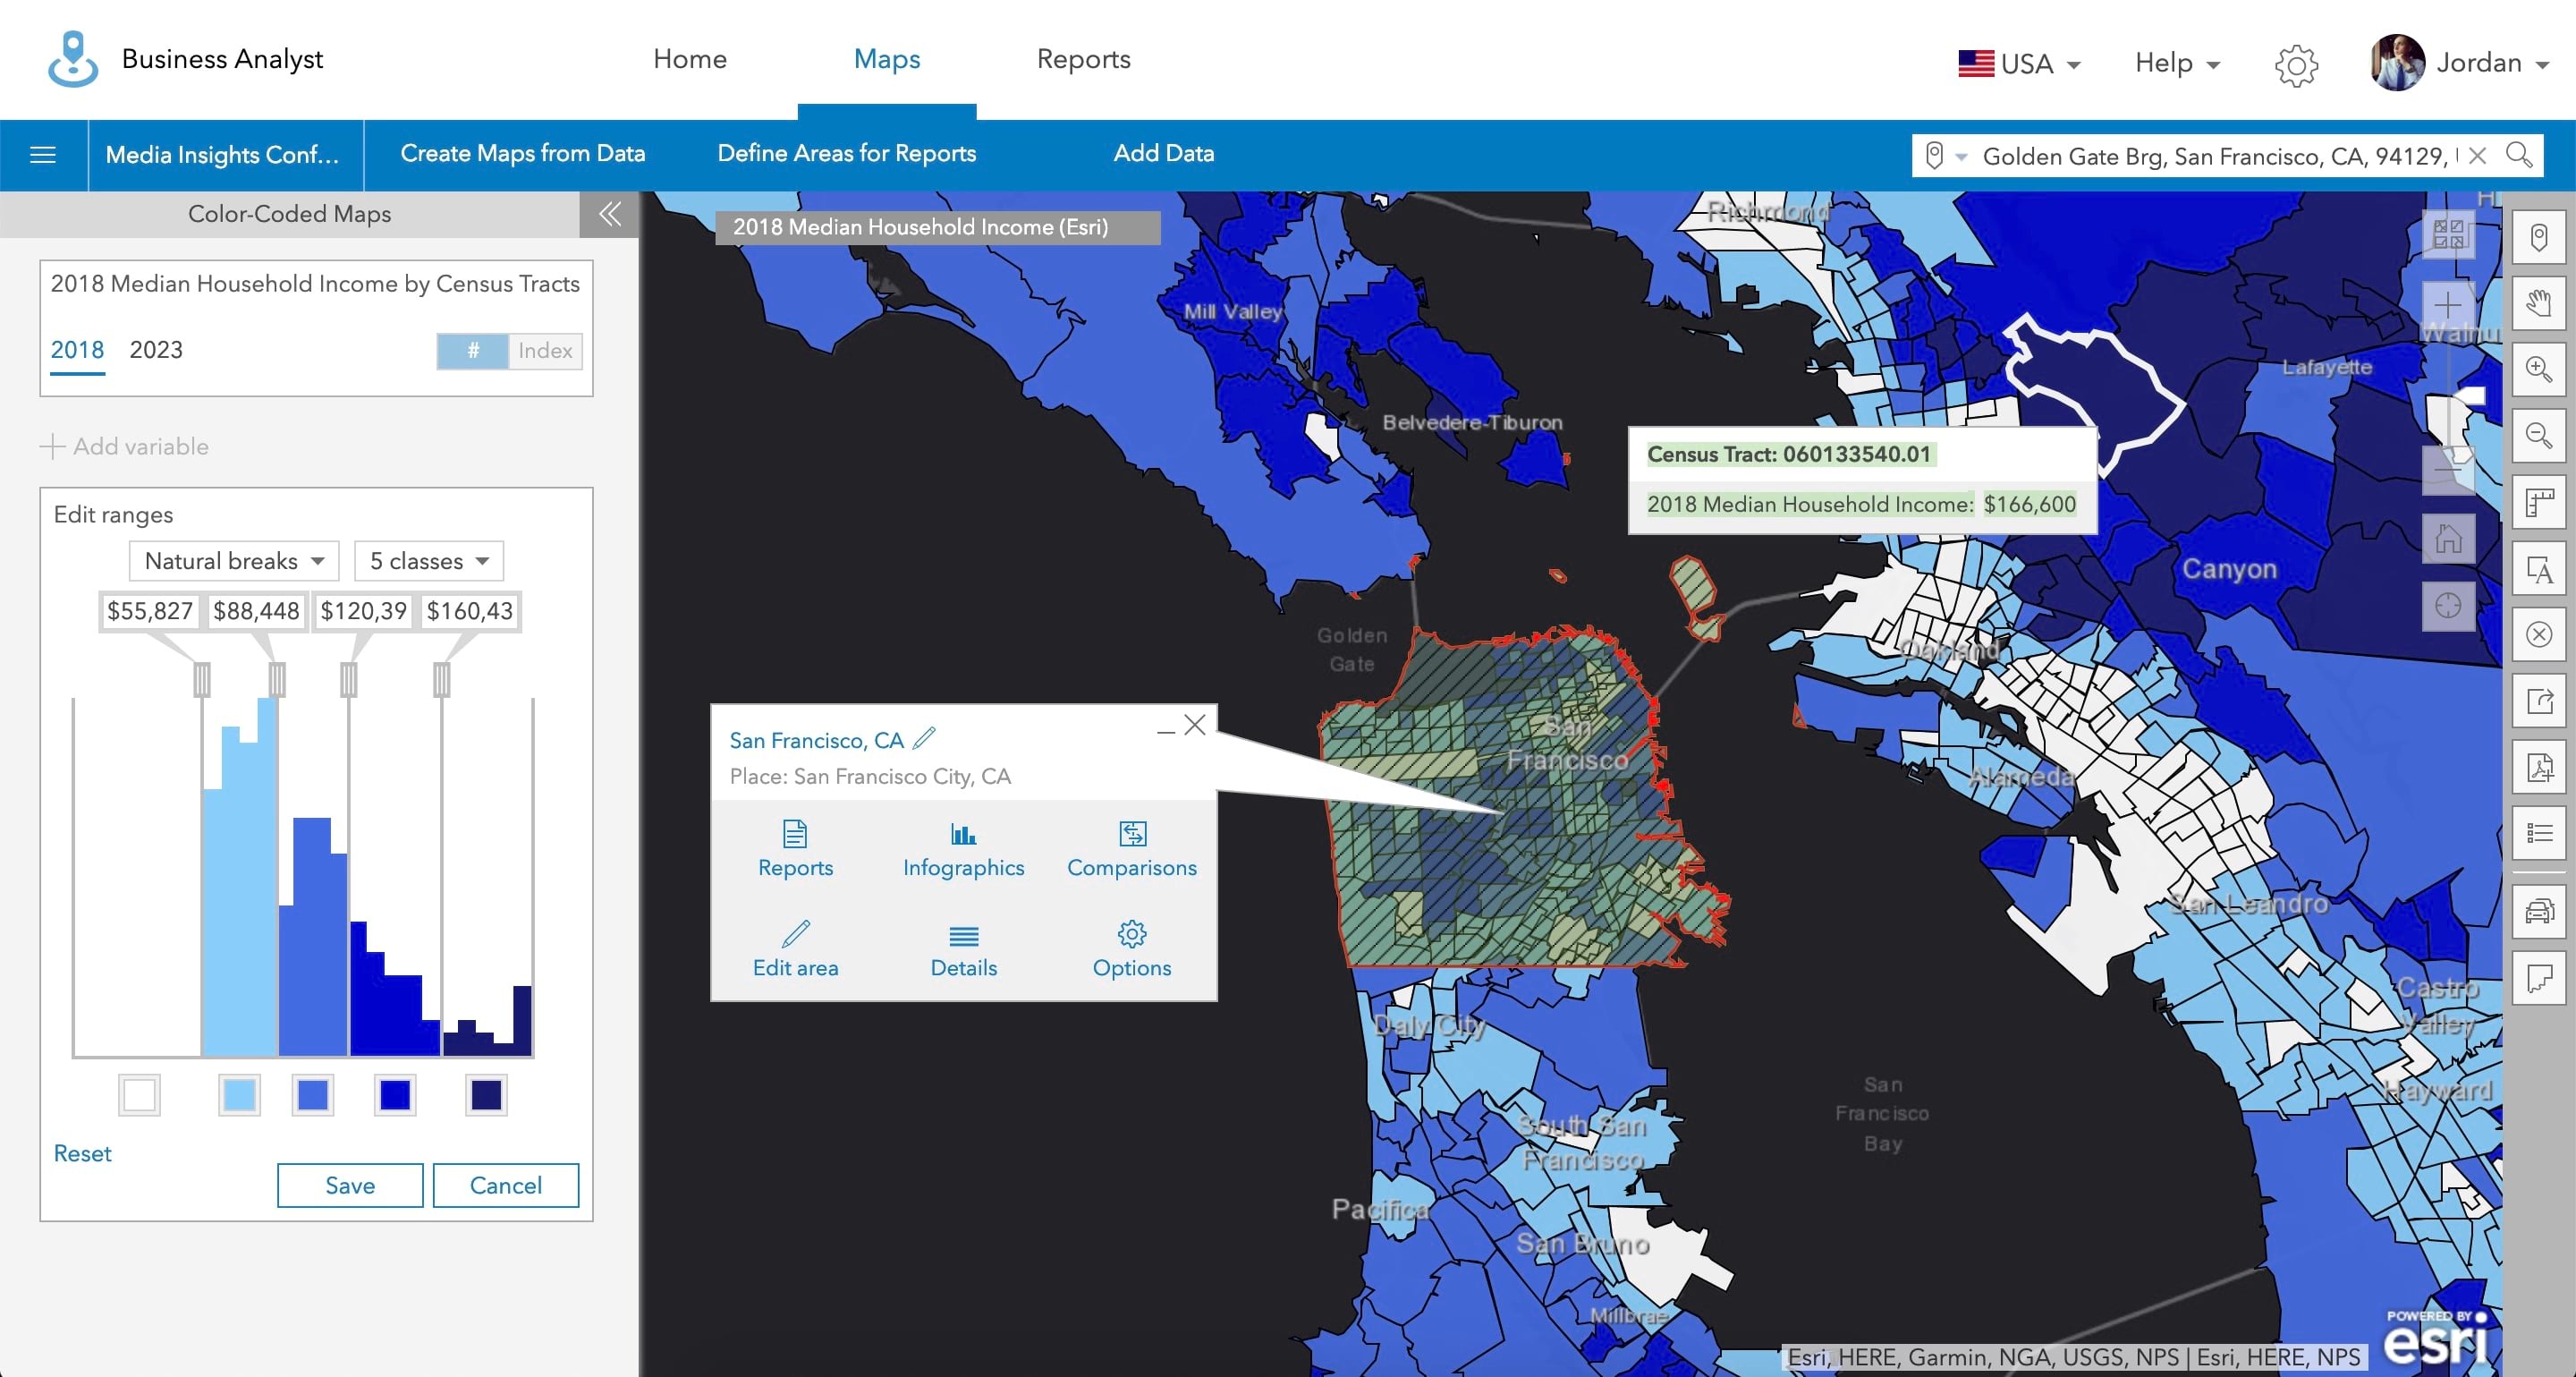
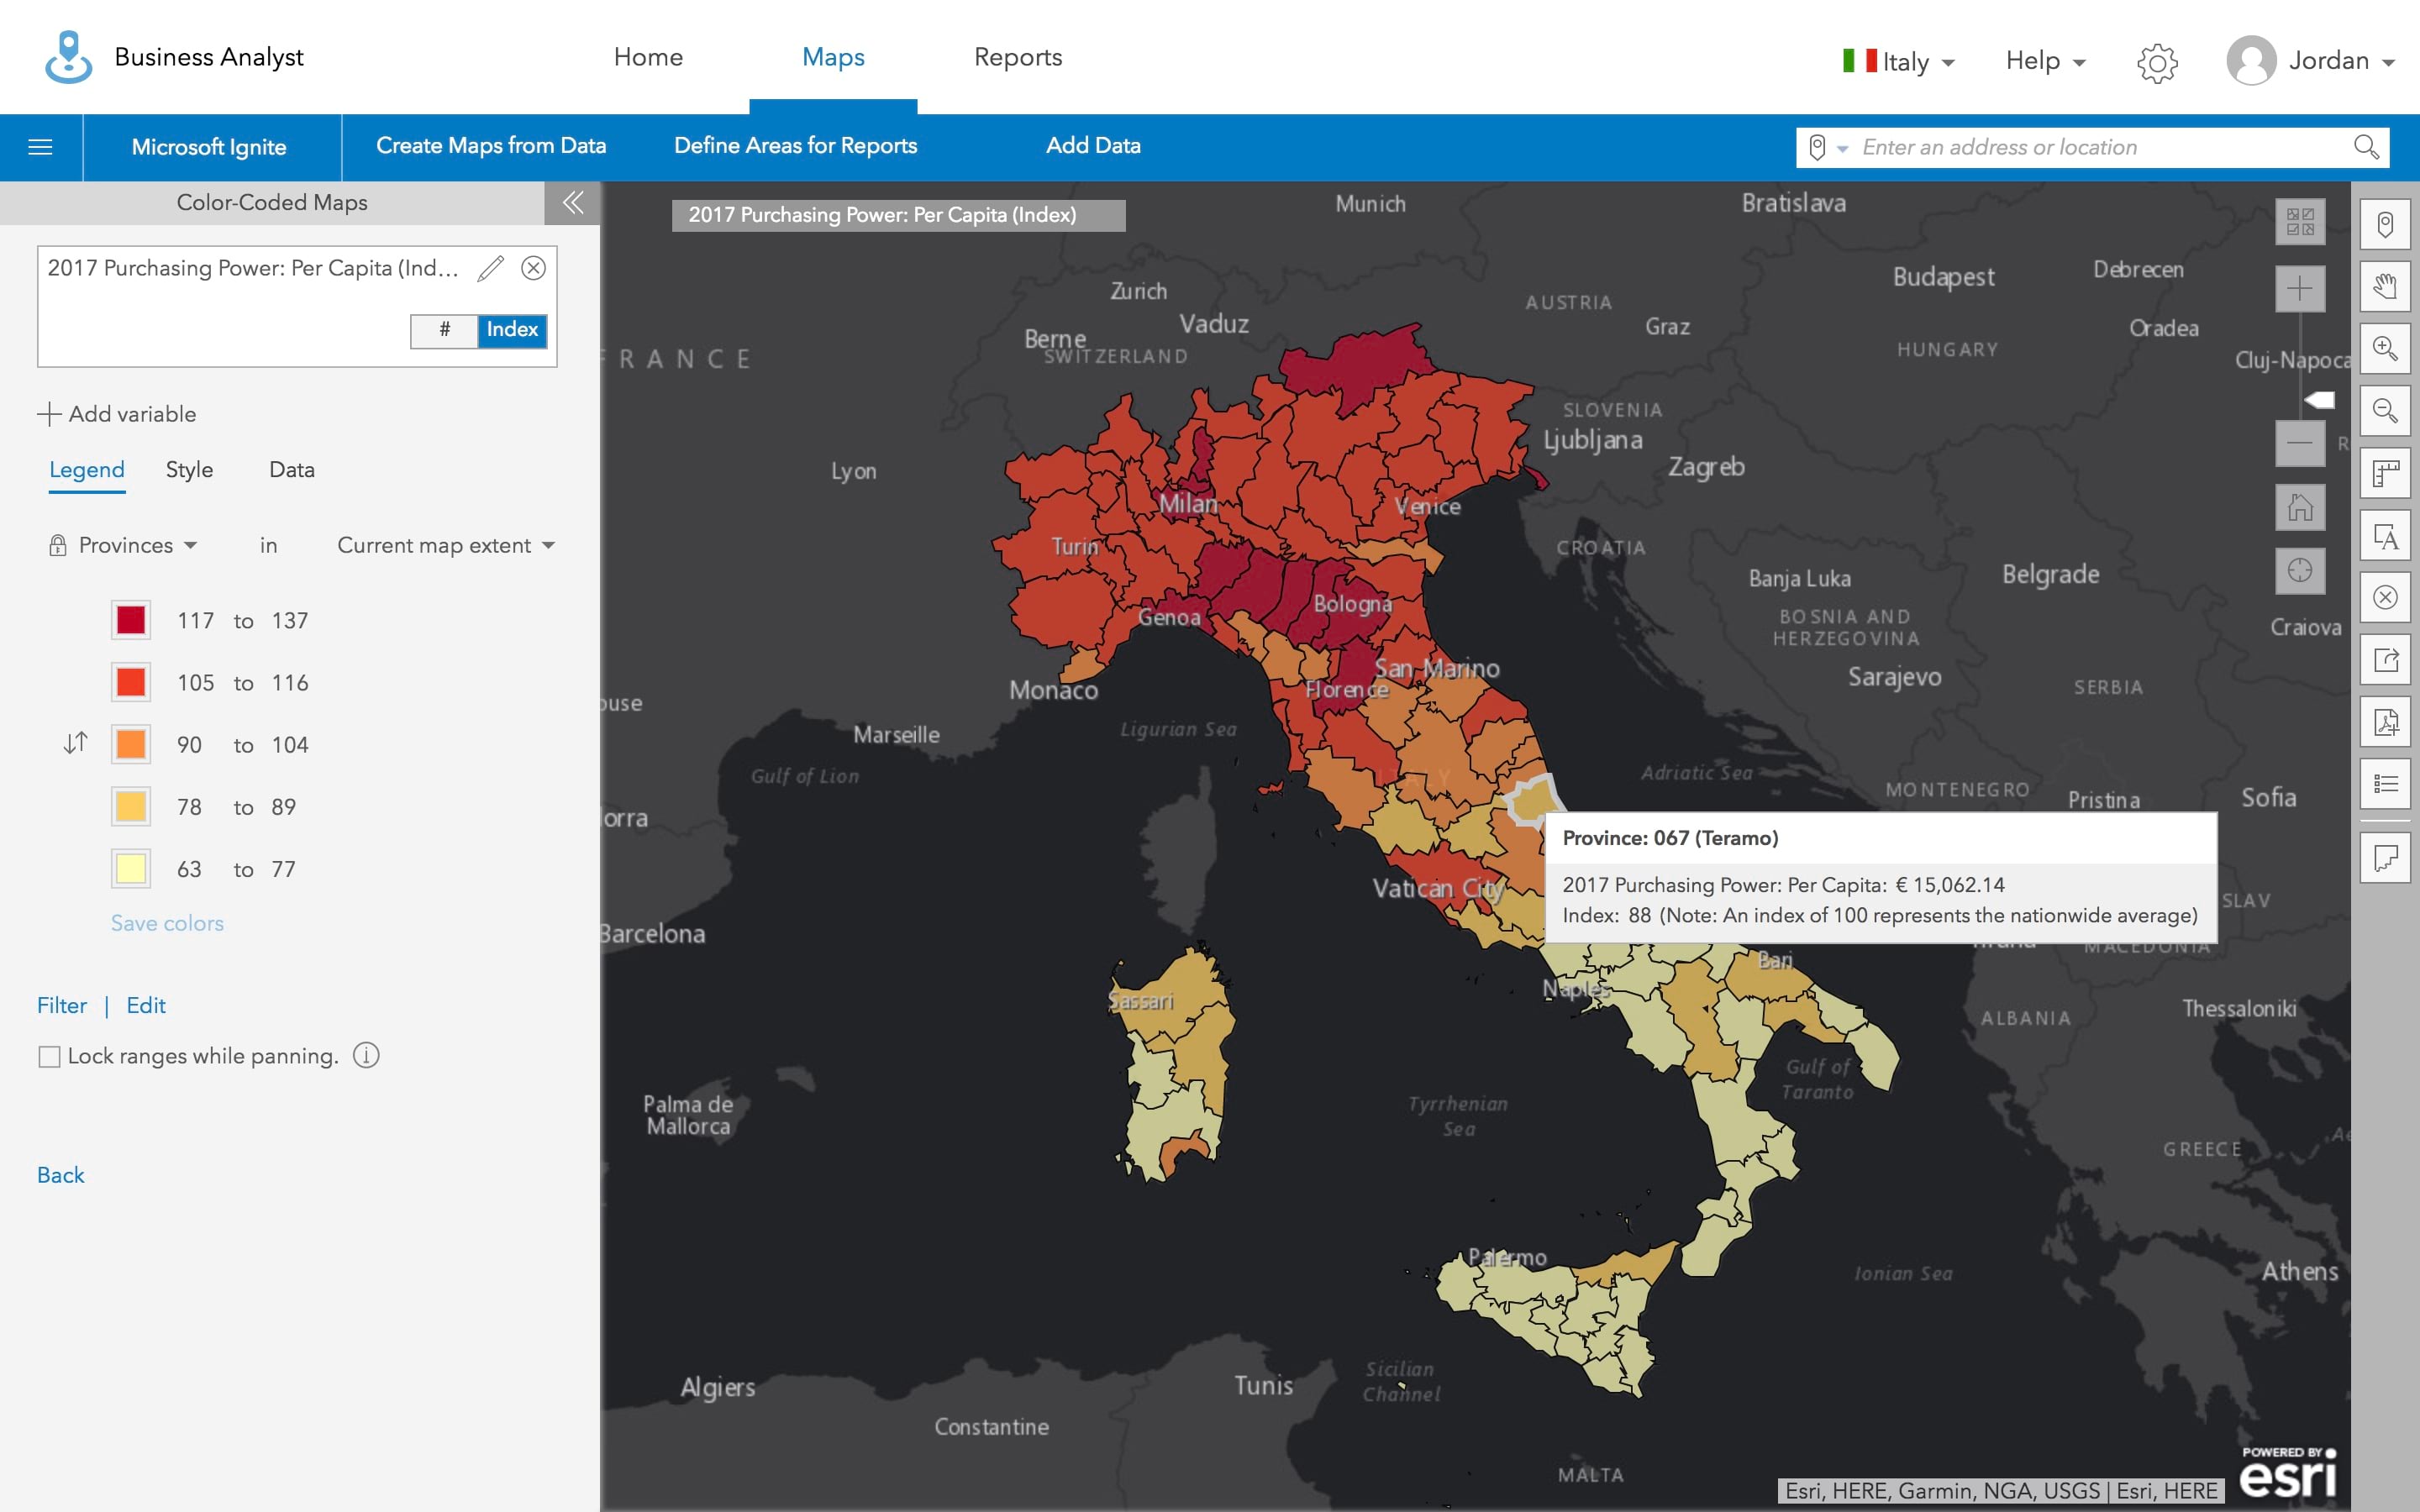
Color-coded maps provide information about your areas of interest. By adding an ombré color effect (color from dark to light) to your areas of interest at several levels of geography, you can explore patterns and reveal insight with demographic information, consumer spending patterns, and other market conditions. From areas the size of a state down to the block group level, you can quickly identify important patterns in the area you are investigating.
Business Analyst Enterprise 10.7 provides feature layers, like color-coded maps, to help you better target new and existing customers or constituents. These feature layers are now published automatically during the data installation; gone are the days of manual data publishing and data copies!
You can learn more about color-coded maps by clicking here.
Explore What’s Nearby
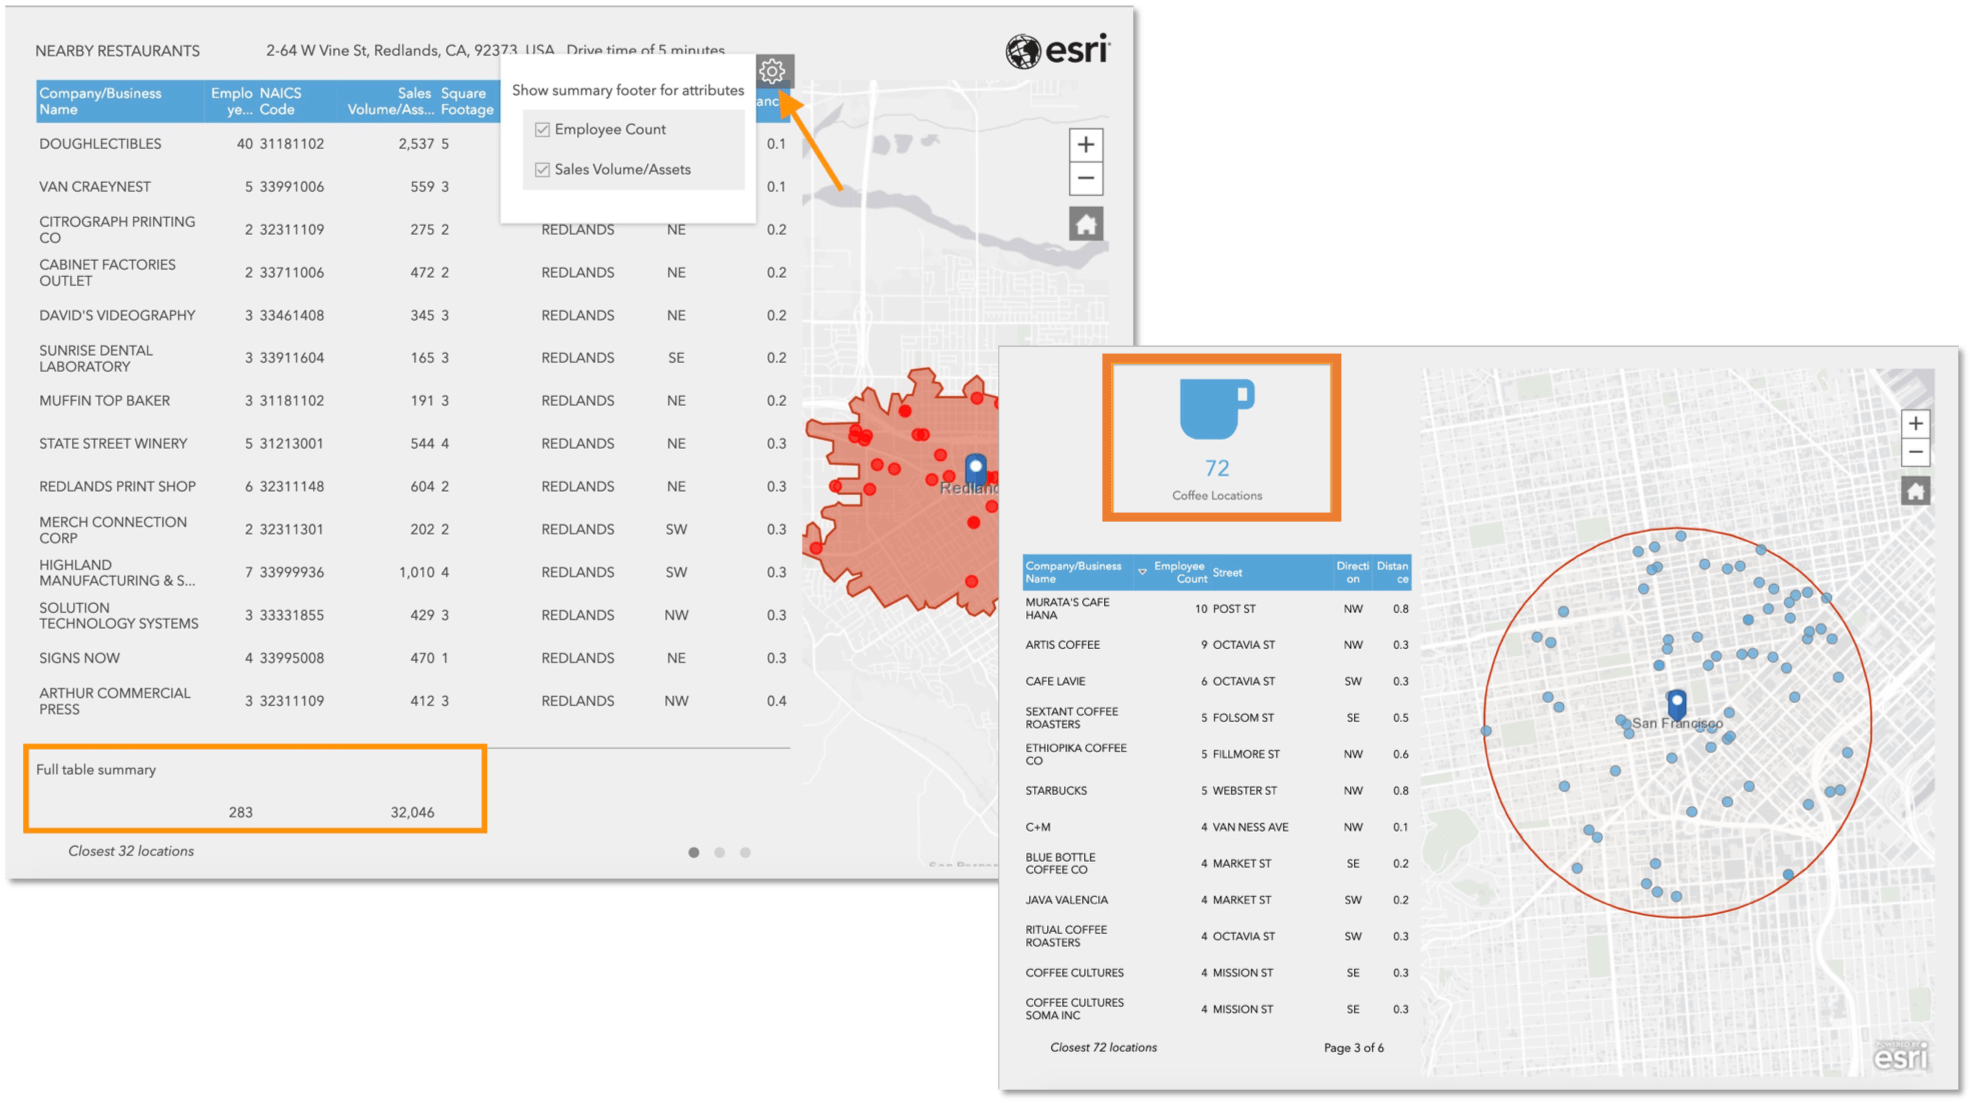
Users can now summarize businesses or any point locations around a designated point or area using the new Nearby capability in infographics and reports in the Business Analyst Web App. This is particularly relevant for any customer that has a physical location for their business or service. Users can now answer questions like, “how many and which coffee shops are within one mile of my proposed new coffee shop,” “which intersections around my site have high traffic counts,” or, “how many banks are within a 10-minute drive from my location and which banks are they?”
You can read more about creating infographics with a Nearby table and other capabilities here.
International Data Options
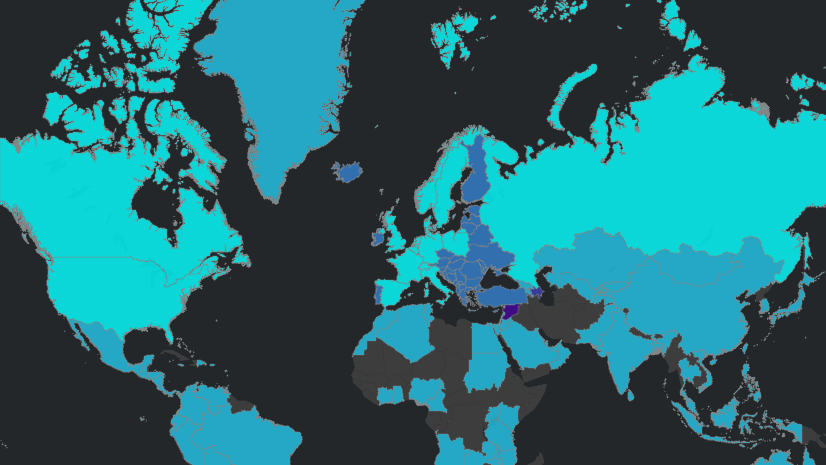
With the 10.7 release of ArcGIS Business Analyst Enterprise, there are now global data options in addition to the content provided for the United States. Via additional licensing, users can purchase regional data packs with coverage for over 135 countries made available by Michael Bauer Research (MBR). You can view the full list of countries here.
We’re so happy to share this release of ArcGIS Business Analyst Enterprise with you. Below you can find some related links that you may find useful.


Commenting is not enabled for this article.