Part 1 of this blog introduced how to enhance your pop-ups using Living Atlas content and the Arcade FeatureSet() function. This technique allows you to bring a layer from ArcGIS Living Atlas of the World into your map, and then access data from that layer within your own layer’s popup. With the October 2019 release of ArcGIS Online, the new FeatureSetByPortalItem() function allows you to pull in data from another layer without needing to add the layer to your map. This reduces the clutter in your table of contents for a slick mapping experience.
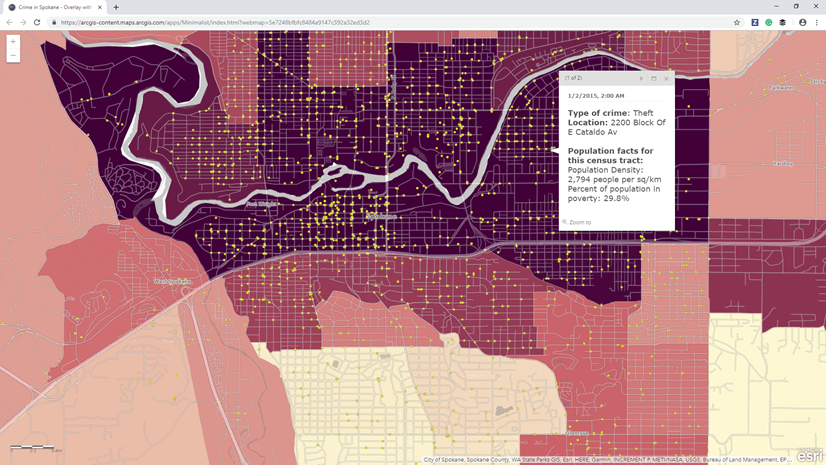
In the last blog, we saw the following example:

This map uses the FeatureSet() function to pull data from two Living Atlas American Community Survey layers to learn more about the population within the Census Tracts where crimes occurred in Spokane, WA. The two demographic facts are pulled from two layers, but only the ACS Poverty Status Variables – Boundaries – Tracts layer is being shown in the map. With the new FeatureSetByPortalItem() function, the ACS Population Variables – Boundaries – Tract layer can be removed from the map, cleaning up the table of contents.
With this new method, the legend only contains the layers being shown in the map, yet it still accesses the same data for the pop-up:

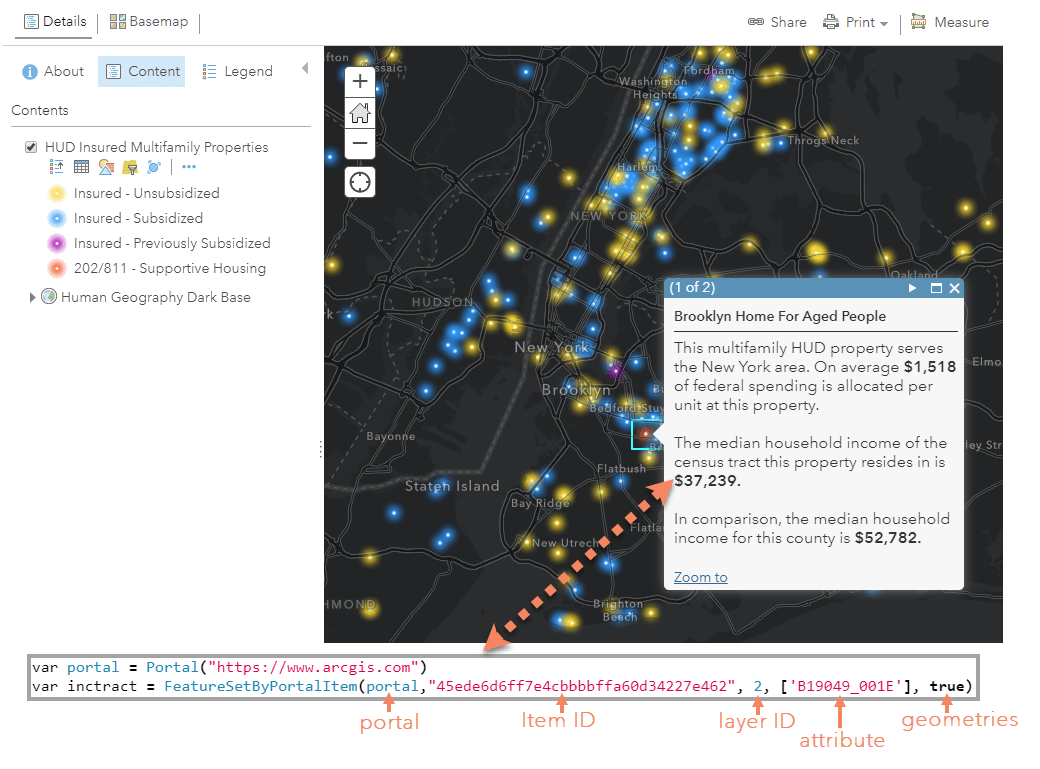
The Arcade expression for this map uses FeatureSetByPortalItem() instead of FeatureSet(), which would look like this:
var pop = FeatureSetByPortalItem(Portal(“https://www.arcgis.com”), “f430d25bf03744edbb1579e18c4bf6b8”, 2);
To use this function, there are a few things you’ll need from the Living Atlas layer (or whatever layer you choose to use):
- The portal where the data is coming from (this is automatically added when you add the function from the function reference)
- The item ID of the layer you want to use
- The layer ID from the service
- [optional] The attributes you want to access if you don’t want all of them. This can speed up your queries.
- [optional] The geometries for the features. If you are using a geometry function, change the default value of false to true
This gif shows how to find the item ID and layer ID:

Let’s see some additional examples of this function being used.
The map below shows insured rental housing properties as recorded by the U.S. Department of Housing and Urban Development (HUD). The map highlights multifamily properties with five or more dwelling units that were built with HUD funding. To add context, the map uses information from a few of the current year ACS layers in order to provide more information about the median household income for the census tract and county where each rental property exists.
This map utilizes two Living Atlas layers, but you only see the HUD layer in the table of contents. It also accesses the geometries because a geometry function is used to determine which tract the property falls within. To speed up the query, the expression also only calls to the attribute used within the pop-up.
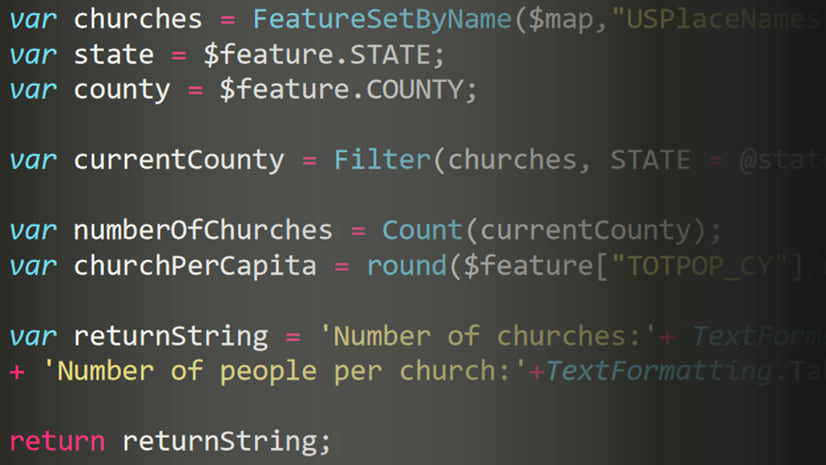
Another way to utilize this powerful function is to pull related data into a pop-up in order to communicate the significance of a local data value. The map below shows renter rates by census tract, but uses the county value to create a comparison. All of the data comes from this housing layer from the Living Atlas which contains the state, county, and tract geography levels. The county’s rank within the state is also calculated. But notice that table of contents only includes the tract geography. Go into the pop-up configuration to see how the county value was brought into the map and ranked:

A world of data at your fingertips
A few tips when using this function:
- Go to the Living Atlas website and browse thousands of feature services
- Open the layer and explore the content you want to bring into your pop-up
- Check out the help documentation to understand the different parameters for this function
- If you’re stuck, try with the classic FeatureSet method and then swap in the new function. Then you can remove the layer from your map for the final version
This new Arcade function allows you to access data from any public ArcGIS Online hosted service item, and opens the door to some incredible pop-ups.

Article Discussion: