Quickly add new information into your pop-ups, no data processing involved! Using the new FeatureSet capability within the arcade language, you can build a pop-up that queries other layers from your map and returns information from those layers to show in your pop-up.
Traditionally, if you had multiple layers in your web map, you would need a separate pop-up for each layer or you would need to go back and re-process your data to get it all into one layer. Now, you can use a single layer to display data from other layers in your map. This makes your maps easier to understand, and easier to navigate for your map reader.
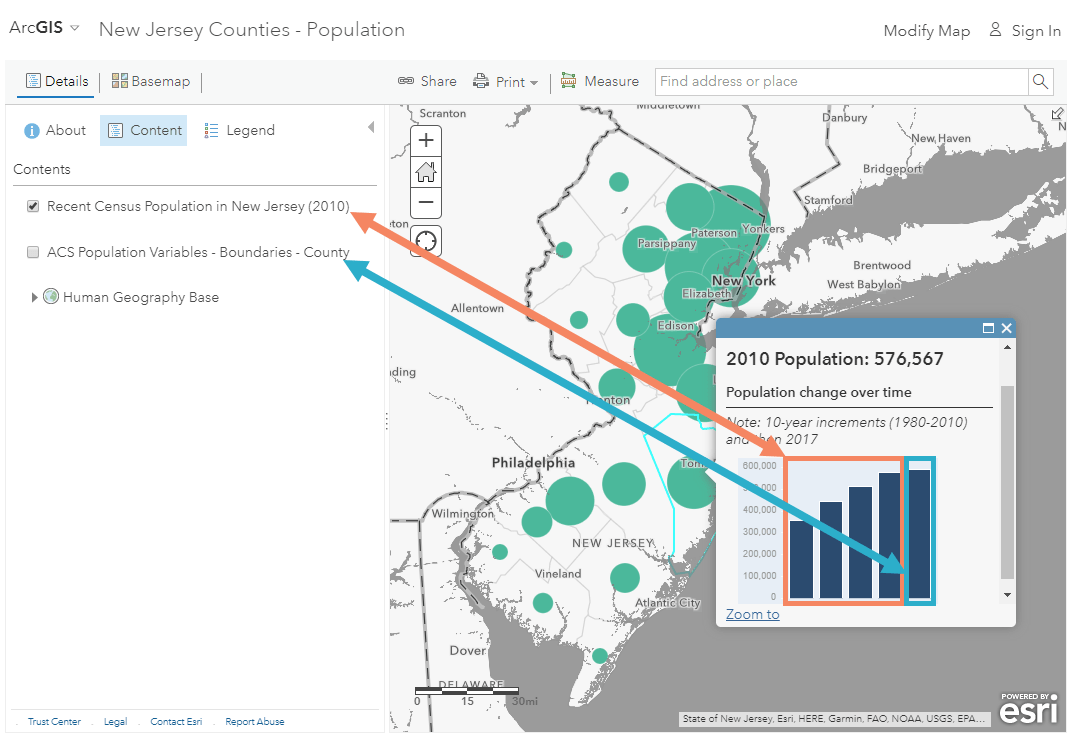
For example, the pop-up for the map below is using data from two different layers. This chart is more interesting and easier to comprehend with all of the data within a single bar chart, rather than two separate pop-ups.
To do this within one of your own web maps, add a layer which you want to access data from (a contextual layer), call to the contextual layer as a FeatureSet using arcade, and define which information from the contextual layer that you want to add into your pop-up. Think of a FeatureSet as exactly that…. a set of features within your map (points, lines, polygons). The contextual layer does not have to be visible in your legend to accomplish this technique.
Need data? The Living Atlas of the World is a great place to find a wealth of data about many different topics such as demographics, the environment, infrastructure, and more. You can find and add data from the Living Atlas directly within your existing web maps. Find a hosted feature layer and add the layer into your web map to access the layer as a FeatureSet.
There are two different ways to accomplish this technique: attribute-related and spatially-related data queries. Let’s walk through an example of each.
Attribute-related data
If there is a common attribute between your main layer and the contextual layer, you can use the Filter() function in Arcade to quickly access attributes from the contextual layer. This can act almost like an on-the-fly join between your two layers. An attribute filter can return the data more quickly than a spatial query, so this should always be the first thing to try if you have a common attribute.
Let’s look at the example we saw above. I have mapped US counties, and want to add information from the new American Community Survey (ACS) layers in the Living Atlas. Because the ACS layers use common Census administrative boundaries, there should be a common FIPS code to match between the two layers. Since there is a common attribute, we will use the Filter() function.

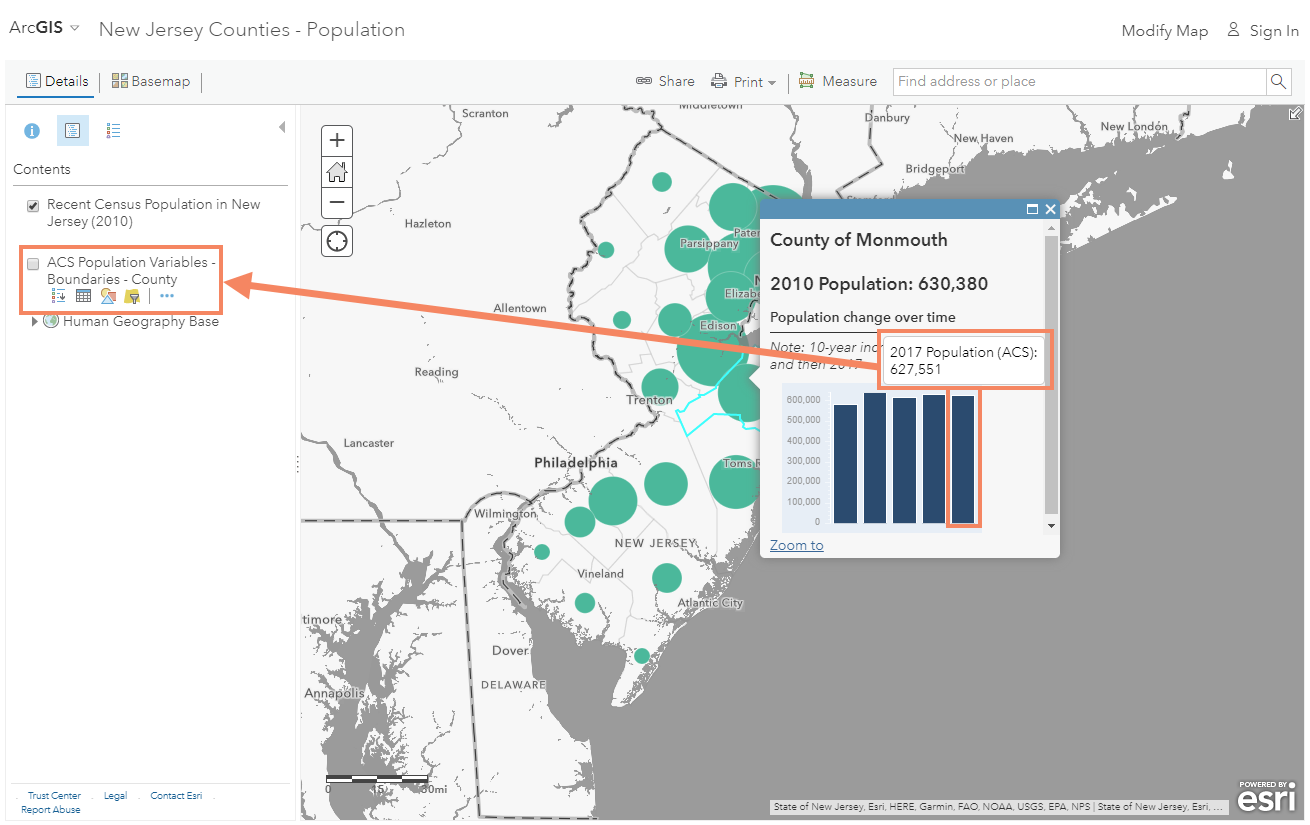
In this example, I have a map of counties in New Jersey where I am mapping population from the 2010 decennial Census. This is my main layer. The pop-up contains population figures from previous Censuses since 1980. I’d like to see where this trend is headed as the 2020 Census approaches. The American Community Survey (ACS) branch of the US Census Bureau offers the most recent population estimates for the United States, and this data has been recently added to the Living Atlas of the World. I will pull the most recent population figure into my main layer’s pop-up using arcade and a layer from the Living Atlas. Below is what my pop-up will look like once I add the new value from the contextual layer. The data value for the new bar in the chart is coming from the Living Atlas layer in the map.
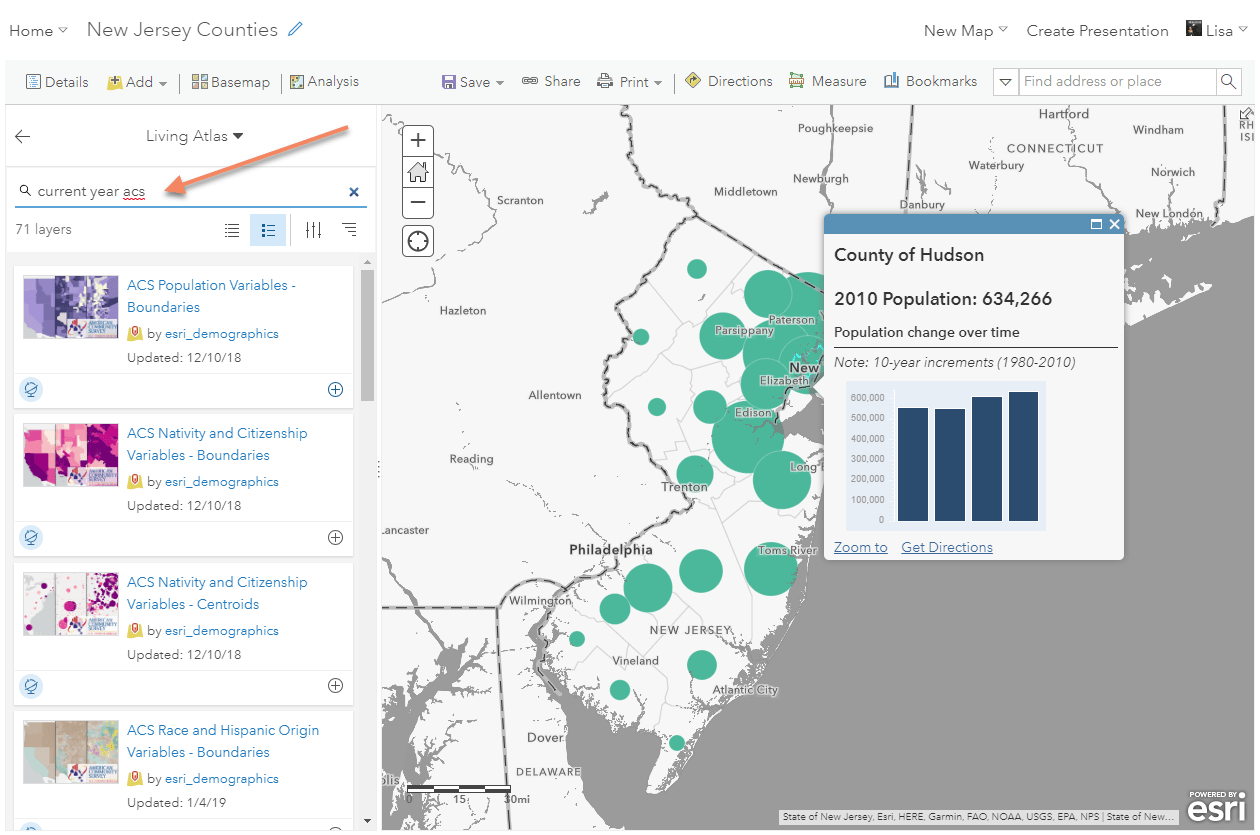
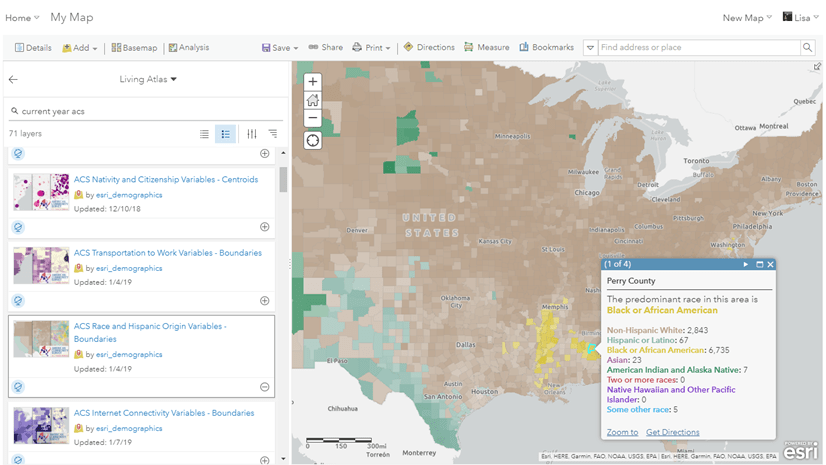
First, I’ll add the ACS Population Variables – Boundaries layer into the map from the Living Atlas. This can be found using the search phrase “current year acs”. This layer comes with states, counties, and tracts, so I’ll remove the states and tracts since I won’t be using them.
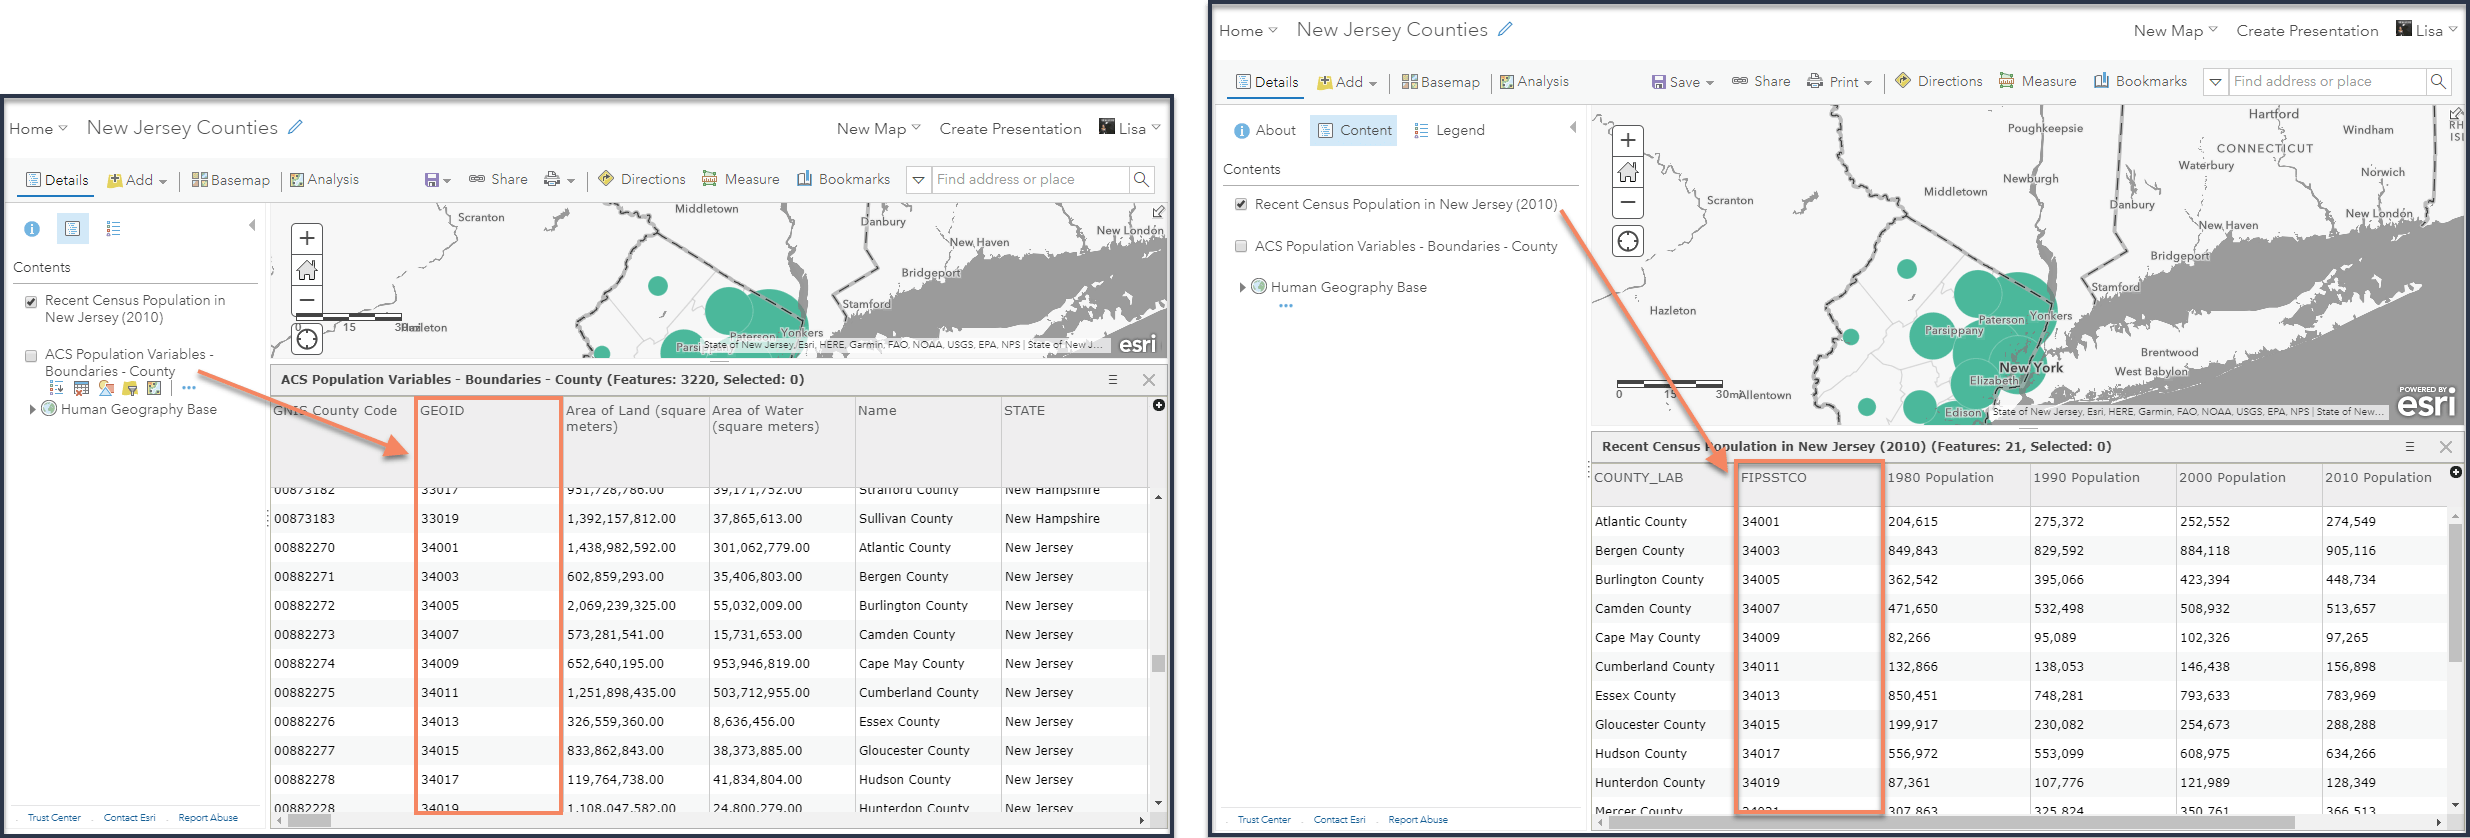
When I open the New Jersey table and the ACS table, I can see a common FIPS code field for the county between them. In the New Jersey layer, this is called FIPSSTCO and in the ACS layer, its called GEOID. These two fields will be used to create my attribute filter.
(click the picture below to enlarge it)
Within the pop-up configuration for the New Jersey layer, I’ll build a new arcade expression which will act like any other data attribute, and it will store the population value I query from the ACS layer.

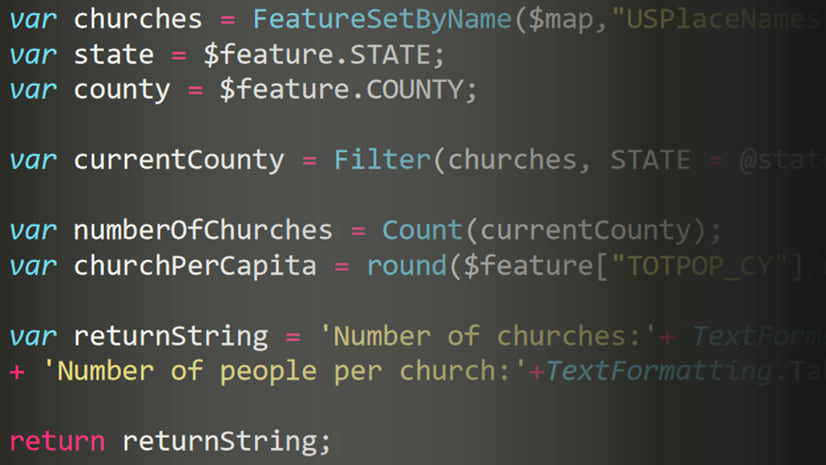
To match each county to its associated county from the contextual layer, I’ll need to write some logic to store the FIPS code from each layer in the map. First, I’ll access the FIPSSTCO field from my New Jersey layer by calling to the attribute using $feature notation. The $feature notation will access a single feature within my layer (a New Jersey county) as the script runs. I store this as a variable so that it can be used later to query the ACS layer for the matching county record.

Now, I need to query the ACS layer. Because it is another layer in my map, this is where I will use a FeatureSet to access the data. To do this, go into $map, which allows you to access all of the layers within the current web map. I will store this as a variable.

To find each matching New Jersey county within the ACS contextual layer, I will use the Filter() function built into the arcade language and interface. We can find the documentation for this tool in the functions list on the right side of the arcade window. Our statement will match the GEOID features in the ACS layer that match the FIPSSTCO code from our New Jersey layer (the variable we stored in the first line of our expression). According to the filter documentation, we can access a variable from our expression using the @ sign. Our statement will be “GEOID = @fips”.

Now, we will use the Filter() function to access the ACS counties that match our New Jersey layer. The documentation for the function says that I’ll filter a FeatureSet by a SQL92 statement, which I have already created variables for in the last few lines of code. So I can easily access them when calling to this function. To test what is returned, I’ll click Test to see the result of what the arcade expression executes at this point. We see that this returns a dictionary of records (a FeatureSet).

Because there is only one record returned, I can use the First() function to access the values quickly. This will access the matching row, which we see when we test. In cases where more than one record is returned, I would use a for loop to investigate all records returned by the filter. This blog has an example of how to use this method.

Finally, I want to access the total population attribute from the county I have queried from the ACS layer, which I can do using the dot notation. An easy way to do this is to find the attribute in the FeatureSet (seen in the gif below). Again, it can help to test the expression’s result to make sure it makes sense. When doing this yourself, make sure to name your expression something meaningful so that it will be useful when accessed throughout the map.
Now that my expression is returning the value I want, I can add the expression to the chart as I would add any other field. The chart in the popup now shows how the population is changing over time as the 2020 Census approaches.

To see the final map and explore the arcade expression, click here.
Spatially-related data
When you don’t have a common attribute between your layers, you can try using an arcade geometry function. These functions evaluate the spatial geometries of your features to do things such as measurements, overlays, assessing proximity, or topological relationships. Keep in mind that this is being done on-the-fly. If you are looking at millions of features, you might need to do the traditional processing in Pro. However, if your dataset is not excessively large, arcade could be a quick-and-easy solution for you. There are many different geometry functions available within arcade that can help narrow down what is being returned. A common geometry function used with FeatureSets is the Intersects() function. This will intersect your layer’s feature against the features in another layer from your map.
In this example, I have theft crimes in my city, and my manager wants to learn more about the census tract where each crime occurred. This example is similar to the attribute-related data example above, except we will use the intersects() geometry function instead of the attribute-based filter function. The Intersects() function will tell us which Census tract the crime falls within, and we can query data about that tract to learn more about the population.
Start by adding the ACS Population Variables and ACS Poverty Variables layers to our map from the Living Atlas the same way shown in the attribute-related example above. Again, we are only using the tract geography level. We will use a lot of the same skills that we saw in the first example. We will access the poverty layer as a FeatureSet, intersect it with our crime, and then query the poverty attribute. In this screenshot, you’ll see that I found the Intersects() function within the arcade window and brought up its help documentation for reference.

Using a similar technique, we will access the total population attribute from the ACS Population Variables layer. Using the AreaGeodetic() arcade function, we calculate area and use it to determine population density for the tract. Population density helps us learn if an area has alot of people in an area. City centers and downtown areas tend to have a much higher population density than suburbs and rural areas.

Using the Text() function and the text formatting within the Globals in the arcade window, we format the results into a readable string.

This will give us the following pop-up:

Final Thoughts
Keep in mind that arcade will not fit all use cases. If your data is extremely large, you will see more performance by calculating the value using geoprocessing tools – arcade isn’t a replacement for python or geoprocessing. Here are a few tips and considerations about using the methods shown above:
- Plan it out. If you want to use a layer within your map as a FeatureSet, explore the data table and features within the map first.
- Write smart expressions. Check out this blog series by my coworker Paul Barker to learn more about FeatureSets and writing efficient arcade expressions: Part 1 and Part 2.
- Test it. If you’re stuck, write a “return” statement and see what your arcade expression will return when it runs.
- Get inspired. Check out these GeoNet posts to see similar methods: Quick Intro to FeatureSets, Drill Down into Other Layers and Tables Using FeatureSets, Create Powerful Popups in Web Apps with arcade FeatureSets
- Not for symbology. Because of the heavy queries being done, FeatureSets are supported for use within pop-ups, field calculation, and attribute rules but not for setting your map’s symbology. Check out the doc page for more information.
- Still confused? This Story Map tutorial walks you through some more examples and explains the power of FeatureSets.

Hi Lisa,
Thanks for providing such a great blog. I have doubts regarding popups.I want to know that how can we add form via link on popups so that user can raise a request by filling form through the single click on feature over the map. I know how to create link on popup but unable to create the link of form. Please help if you know how to do it.
Thanks in advance
Regards,
Sanchi Gupta
I am trying to follow along and recreate this example. I have the ACS service layer, but cannot locate the NJ county layer. And is there a full example of the arcade code available? Many thanks.
Is it possible to return attachments for attribute related data?
Great question. You can access information about the attachments, but unfortunately you can’t currently access the data file itself.