The transportation sector is the largest source of greenhouse gas emissions in the United States, producing slightly more GHG than electricity generation and industrial activities, and more than residential, commercial, and agriculture activities combined. Climate experts point to collective action as a way to fight climate change—action such as personal use of an electric vehicle (EV). Driving an EV is an individual decision that, when reproduced on a mass scale, would reduce GHG emissions. While federal, state, and local governments have encouraged a transition to EVs with massive subsidies, which has helped EV demand continue to expand in the past decade, EV adoption is still relatively far from mass adoption.
The main reasons consumers have not fully embraced EVs are due to a few limitations to EVs, such as range anxiety. Range anxiety is the fear that EV batteries will run out of charge before reaching one’s destination. The root of the charging network challenge is a classic market failure: the “which comes first” (“chicken or egg”) problem. On one hand, consumers are wary of buying EVs without enough charging infrastructure to support them, limiting demand. On the other hand, firms are reluctant to invest in charging infrastructure without enough EVs to support that investment, limiting supply.
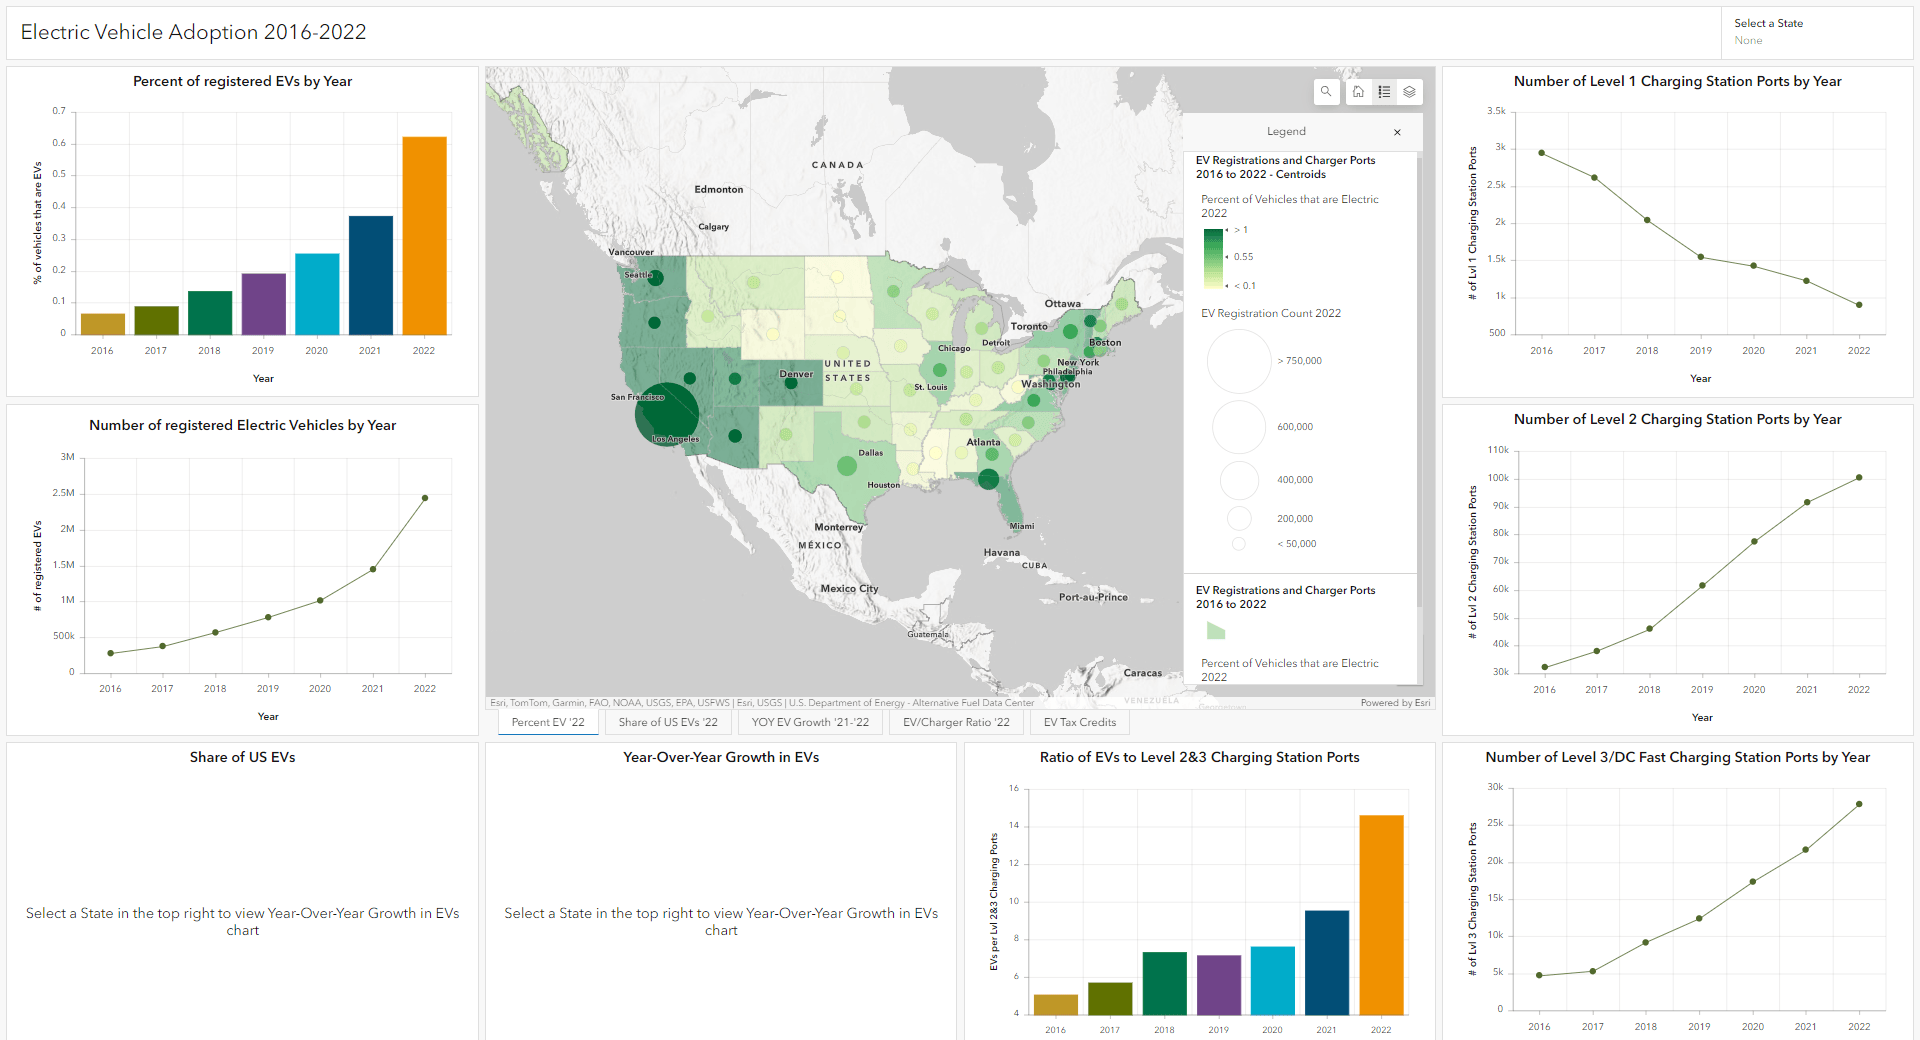
This blog article will walkthrough tracking of how both EVs and EV charging stations have been adopted across each state in the US from 2016-2022.
Electric Vehicle Demand
On a nationwide basis, EV demand has continued to rise steadily, with EV registrations up from 280K vehicles in 2016, to 2.4 million in 2022. From 2021 to 2022 alone, the EV market saw a 68% increase in Year-Over-Year growth in EV registrations.
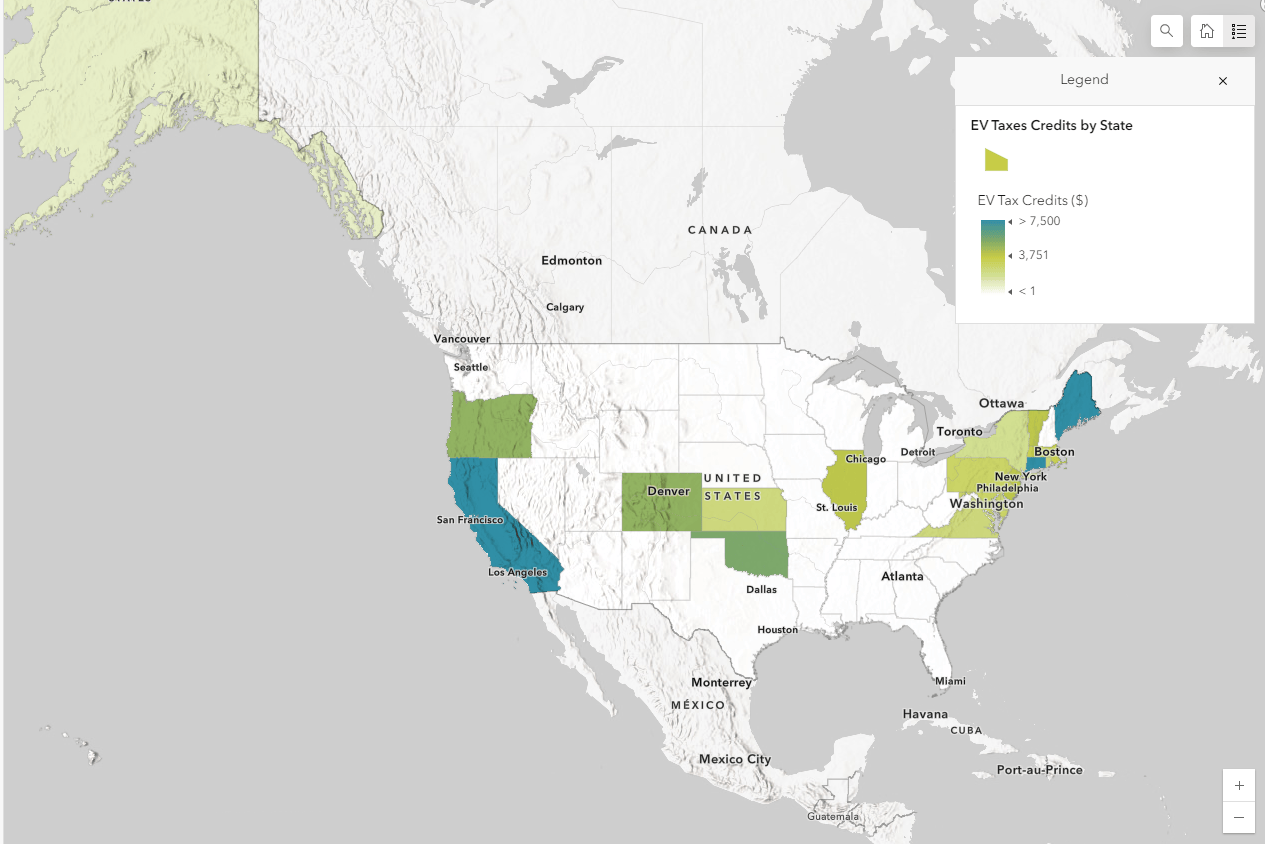
A number of factors are helping to increase sales in the United States. A greater number of available models, beyond those offered by Tesla, the historic leader, helped to close the supply gap. Given that major companies like Tesla and General Motors had already reached their subsidy cap under US support in previous years, new models from other companies being available means that more consumers can benefit from purchase incentives, which can be as high as $7,500. Awareness is increasing as government and companies lean towards electrification: in 2022, a quarter of Americans expect that their next car will be electric, according to the American Automobile Association.
Electric Vehicle Charging Station Supply
A vital part to the adoption of EVs is an ample supply of reliable level 2 and level 3 (DCFC) charging stations that charge in a reasonable amount of time. While the 80% of all charging is done at home, not everyone has access to home charging, and there will always be a need to charge outside of one’s residence when taking long trips. To meet this demand, over 100,000 public chargers will be made available for the buildout of a coast-to-coast EV charging network across the U.S. through the 2021 the Bipartisan Infrastructure Law. Five billion USD in total funding will be allocated over the 2022-2026 period through the National Electric Vehicle Infrastructure Formula Program, as well as 2.5 billion USD in competitive grants over the same period through the Charging and Fueling Infrastructure Discretionary Grant Program.
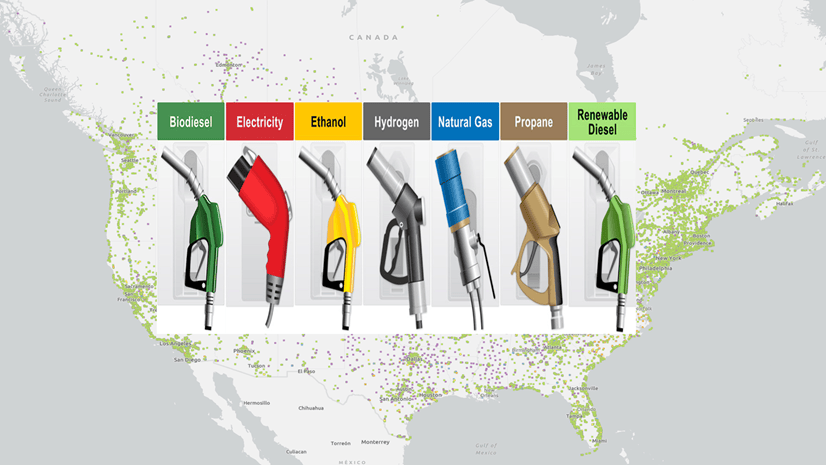
To dig deeper into EV Charging Stations, the Electric Vehicle Charging Stations layer in the ArcGIS Living Atlas of the World can be used to create thought-provoking maps, perform analyses to solve complex problems, and as well telling interesting stories. Whether you just want to know where certain alternative fuel stations are/ are not, what the demographic characteristics are around these stations are, or how many stations you can reach within a certain drive-time, this layer can help answer these questions and many more.
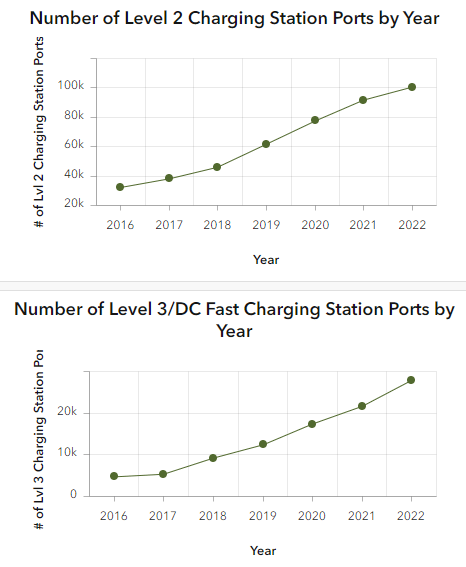
Across the U.S., there has been a steady increase of level 2 and level 3 (DCFC) charging stations from 36,942 charging ports in 2016 to 128,431 in 2022, an overall increase of 91,489 Level 2 & 3 (DCFC) charging station ports. While this number has gone up significantly, so has the demand of EVs.
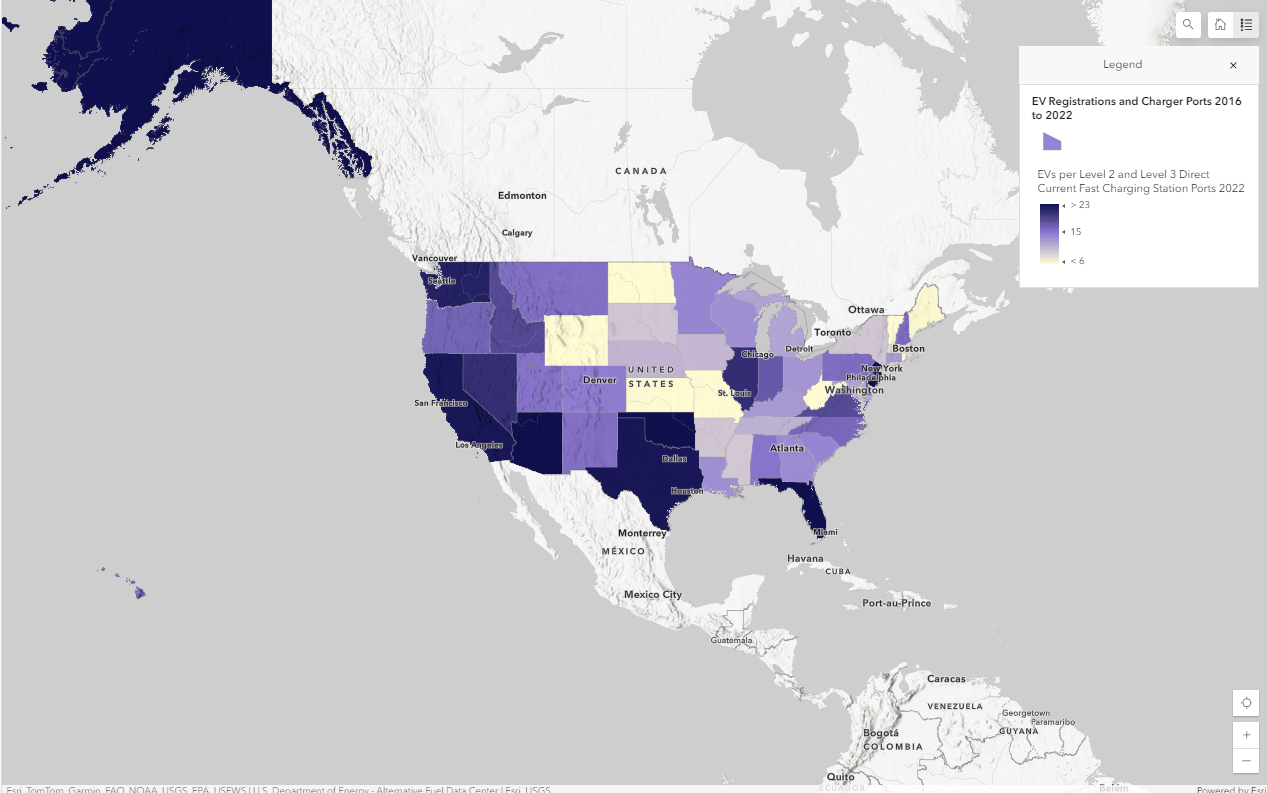
In order to determine if the supply of charging stations is meeting the demand of EVs, one measure is to calculate the ratio of EVs to charging station ports. Benchmarks set by the International Energy Association (IEA) suggests the minimum acceptable ratio of EVs to charging stations is about 10 EVs for every 1 charging station. The map below shows each states EV to charging station ratio. States in yellow indicate they have a lower ratio of EVs to level 2 and level 3/Direct Current Fast Charging station ports, while areas in dark purple indicate they have a higher ratio of EVs to level 2 and level 3/Direct Current Fast Charging station ports.
Why do states have different rates of adoption?
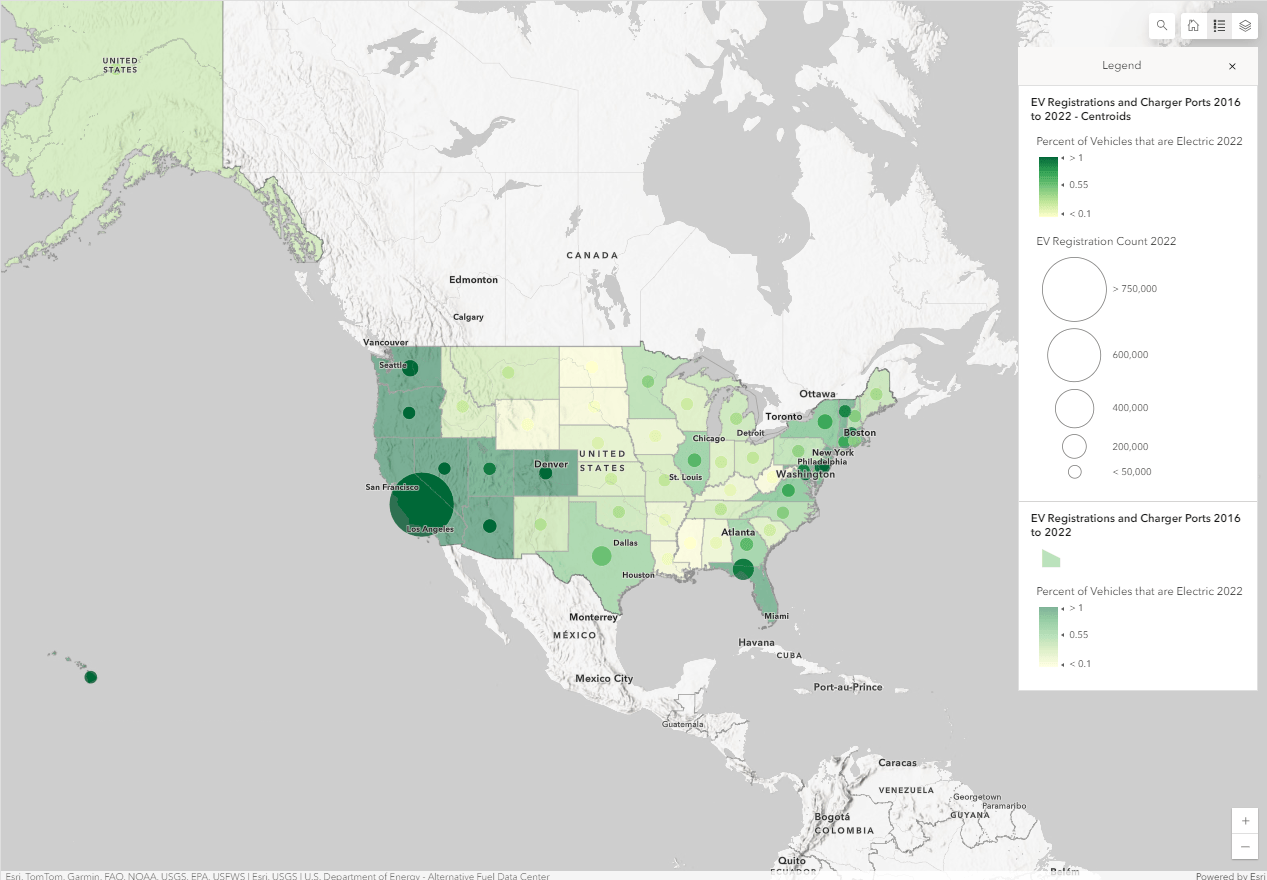
While the overall percentages of vehicles that are EVs per state is still low across the U.S., the U.S. grows increasingly divided on EV adoption. The U.S. is being split into states that have embraced EV adoption, and those that have not. States that embrace EV adoption have offered incentives such as tax credits and rebates for purchasing EVs, as well as building the infrastructure needed to support EVs.
Research from the Division of Resource Economics and Management, West Virginia University has shown that state environmental policies encourage EV adoption more than financial incentives, with tax credits having a greater impact on EV adoption than rebates.
More to Come
This blog and its maps and dashboards will be updated as new data becomes available. 2023 EV registration data will become available later in summer 2024, stay tuned!
Looking for inspiration on how to use the EV Charging Stations layer?
View this collection of ArcGIS StoryMaps on electric vehicle charging. This collection delves deeper into the electric alternative fuel stations and how EV Charging is being implemented across the U.S.

Article Discussion: