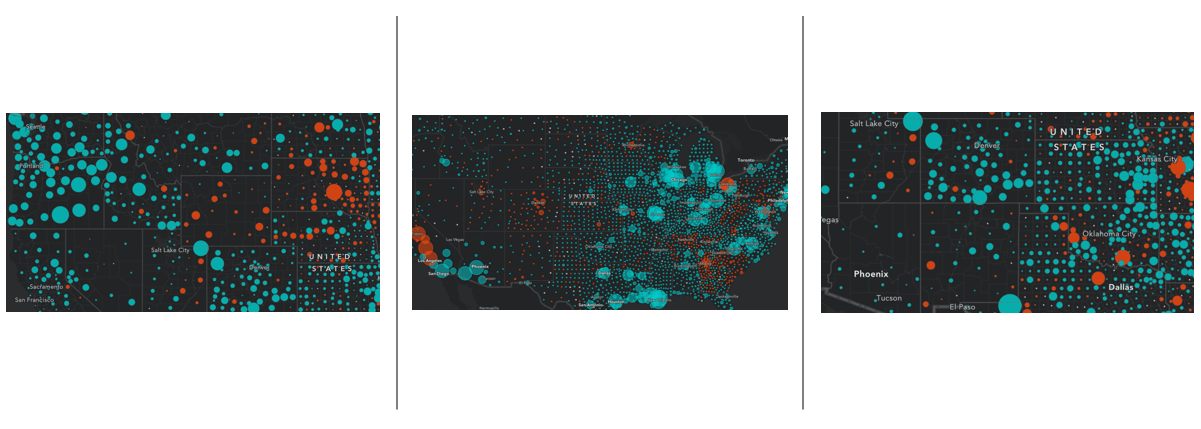
Earlier today (Wednesday, April 29th), the U.S. Bureau of Labor Statistics put out their preliminary county-level unemployment numbers for March 2020. This data is now available in one of the newest layers in ArcGIS Living Atlas of the World: Bureau of Labor Statistics Monthly Unemployment (current 14 months). This is a multi-scale layer that contains state and national numbers for reference.

This layer will update every month soon after Bureau of Labor Statistics’ data release
That’s correct! Any maps you make with these layers will be refreshed with new data values very soon after the new data is available. This means you do not have to build new web maps each month, because your maps will always display the latest data. We do recommend you check your maps after the data is refreshed to make sure that your symbology choices still make sense given the new values.
How can I use this layer?
Add this layer into a web map straight from Living Atlas. You can create a customized web map to use in a StoryMap, dashboard, configurable app, or to embed in your organization’s website. Perhaps start by filtering to your state, or changing the pop-up configuration to better serve your needs. Some example maps show the change in those unemployed from last month, change in those unemployed from last year, and change in unemployment rate since last month.

A wealth of attributes provide many mapping possibilities
- Unemployment rate (%)
- Count of unemployed population
- Count of employed population
- Count of people in the labor force (employed + unemployed)
These numbers are not seasonally adjusted. The figures for the latest month are preliminary and subject to revision.
Unemployment Rate vs. Unemployment Claims
This unemployment data is not based on claims data, but rather, anyone who does not currently have a job, who has been looking for a job in the past 4 weeks, and is available to start work. This includes new entrants to the labor market who did not have a previous job, and those who lost their job but did not file an unemployment claim (possibly because they were working an informal job, possibly because they were nearing retirement anyways, possibly because they don’t know how to file an unemployment claim, or possibly because of all kinds of other reasons).
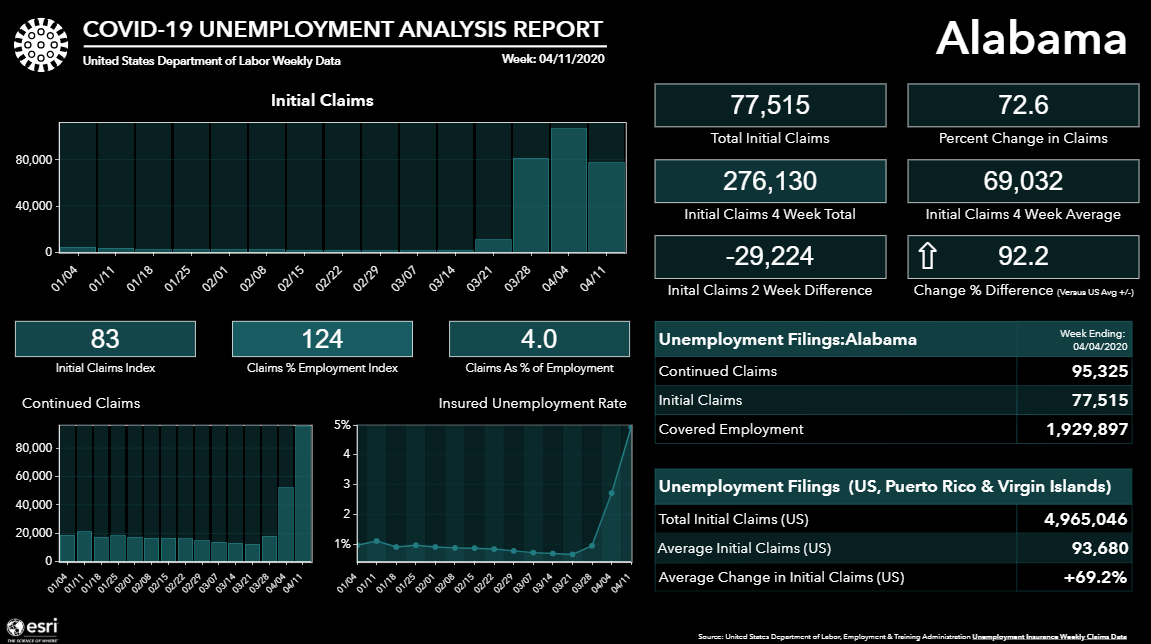
If you are interested in state-level weekly claims data, Esri’s Business Industry Solutions team does have a layer and a dashboard available.

Questions about this county-level monthly unemployment layer?
For more information and details, see the layer’s Description, as well as the long field descriptions for each attribute. Head over to GeoNet’s ArcGIS Living Atlas space to ask other GIS analysts and professionals who use Living Atlas content, or share how you’re using this layer!


Article Discussion: