The past two years have caused governments, community organizations, businesses, and even individuals to focus a lot more on health. Increasingly, people are seeking health data at a very local level. Effective public health planning requires high-quality health estimates for small geographic areas.
Enter the CDC’s PLACES (Population Level Analysis and Community Estimates) Project, whose tagline is “Local Data for Better Health.” This project is the first-ever project to release health information for many geography levels:
- counties
- places
- census tracts
- Zip Code Tabulation Areas (ZCTAs)
This system complements existing health surveillance data by providing estimates necessary to understand the health issues affecting the residents of local areas of all sizes and regardless of urban or rural status; develop and implement effective and targeted prevention activities; identify health problems; and establish key health objectives. The PLACES Project is an expansion of the original 500 Cities project, reflecting innovations in generating valid small area estimates for population health.
CDC PLACES Living Atlas Items
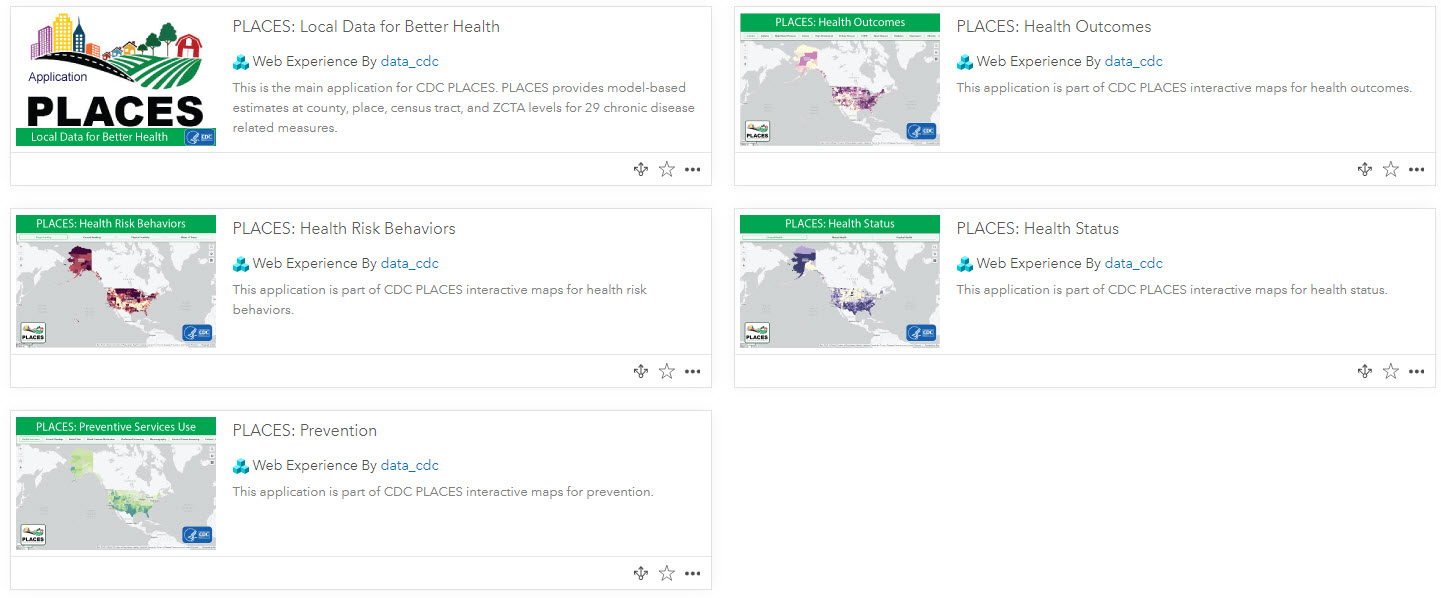
The feature layer available in ArcGIS Living Atlas provides Centers for Disease Control and Prevention (CDC) model-based population-level analysis and community estimates for 29 chronic disease related measures for all counties, places, census tracts, and ZCTAs. Since December 2020 when it was shared publicly, this popular feature layer has been viewed nearly 6 million times so far. That’s because this 1 feature layer powers 30 maps and 5 web applications, all recently updated with more recent data in December 2021.
That’s right – there are 30 multi-scale maps on topics such as Arthritis, High Cholesterol, and Mental Health. These maps now display more recent data. New with this update are two new maps on Depression and General Health. All maps have an informative pop-up that communicates the more details about what is being displayed in the map. The maps are all useable by themselves as Living Atlas items, and are all viewable in the capstone application that the GIS analysts at CDC created using ArcGIS Experience Builder.
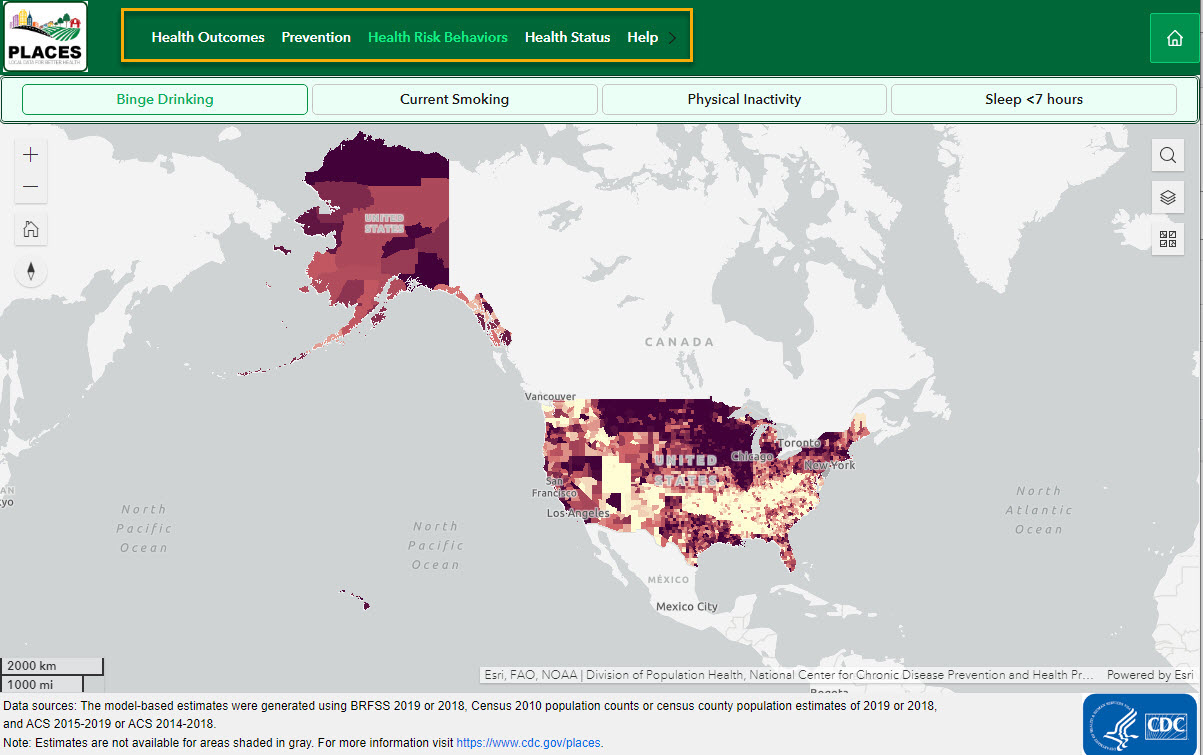
The capstone application
This app allows local health departments and jurisdictions, regardless of population size and urban-rural status, to better understand the burden and geographic distribution of health-related outcomes in their areas and assist them in planning public health interventions. Use this app to explore your own community’s health profile. If you work at a state or regional level, see which communities are in most need of assistance, or identify emerging health problems or risk behaviors.

The app has a category menu on the top row which allows you to choose from the four major categories: Health Outcomes, Prevention, Health Risk Behaviors, and Health Status.

Use CDC PLACES data in your work
The feature layer behind it all is available in Living Atlas for your analysis workflows in ArcGIS Online, ArcGIS Pro, or ArcGIS Insights. This well-documented feature layer contains descriptive field aliases to assist you as you work. You can also create your own web maps, informative dashboards, captivating stories, and focused Instant Apps with the CDC PLACES data to understand your the health of your community and inform your stakeholders.
More Information
- For more information on CDC PLACES project, including measure definitions and methodology, visit https://www.cdc.gov/places. There’s even a list of programs and interventions that have been shown to promote population health and well-being, and reduce health care costs.
- Post specific questions about these or other Living Atlas items on the Esri Community Living Atlas page. Post specific questions about creating apps such as these on the Esri Community Experience Builder page.
- Find other Living Atlas favorites from CDC, such as older vintages of the 500 Cities Project (now PLACES), or the CDC Social Vulnerability Index. CDC has been a long-time contributor to ArcGIS Living Atlas. We thank them very much for contributing their high-quality items to the GIS user community!
CDC PLACES related text throughout this blog was sourced from materials on https://www.cdc.gov/places/.


Article Discussion: