Heart disease is the leading cause of death in the United States. This is true for both men and women, and for most racial and ethnic groups. About one in every four deaths can be attributed to heart disease. Heart disease also costs the United States hundreds of billions in health care services, medicines, and lost productivity (Source: CDC Heart Disease Facts).
Many organizations are trying to better understand where to intervene. Naturally, mapping is part of this work. The Centers for Disease Control and Prevention (CDC) recently contributed the most recent county-level hospitalization and mortality rates for both heart disease and stroke from the CDC Interactive Atlas of Heart Disease and Stroke to ArcGIS Living Atlas, as well as high blood pressure medication nonadherence rates. High blood pressure is a key risk factor for heart disease.
Newly released layers include:
- U.S. Heart Disease Mortality Rates, 2016-2018
- U.S. Heart Disease Hospitalization Rates, 2015-2017
- U.S. Stroke Mortality Rates, 2016-2018
- U.S. Stroke Hospitalization Rates, 2015-2017
- U.S. High Blood Pressure Medication Nonadherence Rates, 2017
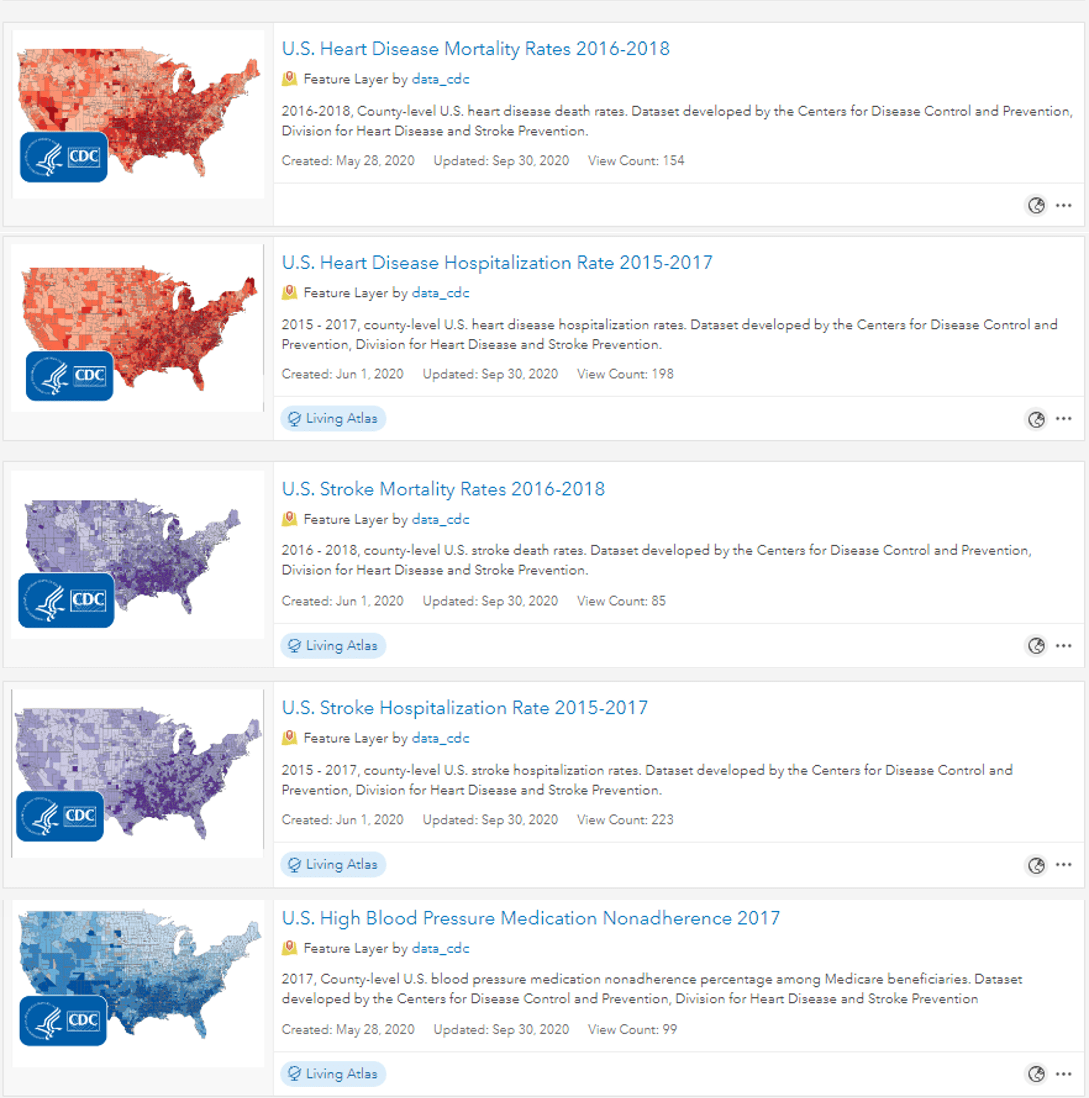
Data available by age, race/ethnicity, gender, and type of medication
The wealth of attribute fields in these layers allows analysts to compare different groups, and focus in on those most at risk. The field aliases make working with all the attributes available painless. The field aliases also come through in auto-generated legends, making your maps easier to interpret.
Mortality
Specifically interested in mortality rates of Black females age 75 and over? This type of data is available at the county-level. Pooling together multiple years of data allows for these types of fine-grained attributes. There are however some counties with small populations where a reliable rate could not be generated. In these cases, try “coarsening” your analysis to only comparing age groups, or only gender groups, etc.
Hospitalization
Hospitalization rates are based on Medicare fee-for-service beneficiaries, so the only age group available is 65 and up. However, race and gender breakdowns are available.
Medication nonadherence
High blood pressure medication nonadherence is available by race/ethnicity and by medication type (Diuretic nonadherence and Renin-Angiotensin System nonadherence).
Previous versions of these layers also available
The CDC has been a long-time contributor to Living Atlas, which means that previous versions of these layers are also available at your fingertips. This enables easy exploration of trends over time. Bring these layers into Pro for your analysis or geoprocessing work.
Enhancement in this year’s layers: configured pop-ups
If you’re familiar with the existing heart disease, stroke, and high blood pressure medication nonadherence layers, you’ll notice that this year’s layers have configured pop-ups. The pop-up presents an easy-to-understand sentence about the topic being mapped, helping turn data into an interactive experience right out of the gate.
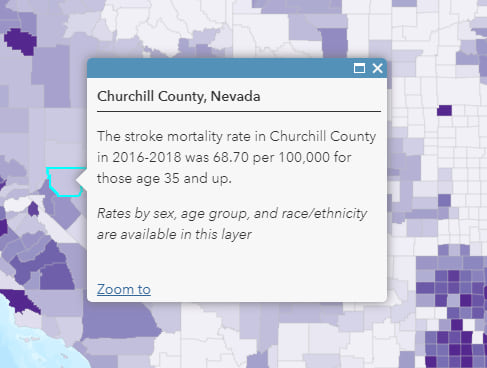
You can easily modify the pop-up you want to appear in your web maps and apps by creating a custom pop-up configuration in ArcGIS Online.
Thank you, CDC!
For these valuable layers, and for all your other contributions to ArcGIS Living Atlas of the World, thank you! This important data has been brought to life in their symbology, field aliases, and pop-ups. Well-documented items such as these support the important work of GIS analysts in local communities across the nation.
Additional Items from CDC in Living Atlas
- Social Vulnerability Index: a tool to help emergency response planners and public health officials identify communities that will most likely need support before, during, and after a hazardous event.
- 500 Cities Project: city- and tract-level data for 28 health measures including unhealthy behaviors, health outcomes, and use of prevention services.
Share how you’re using these layers in your work, or ask questions to the user community over in GeoNet’s Living Atlas space.




Article Discussion: