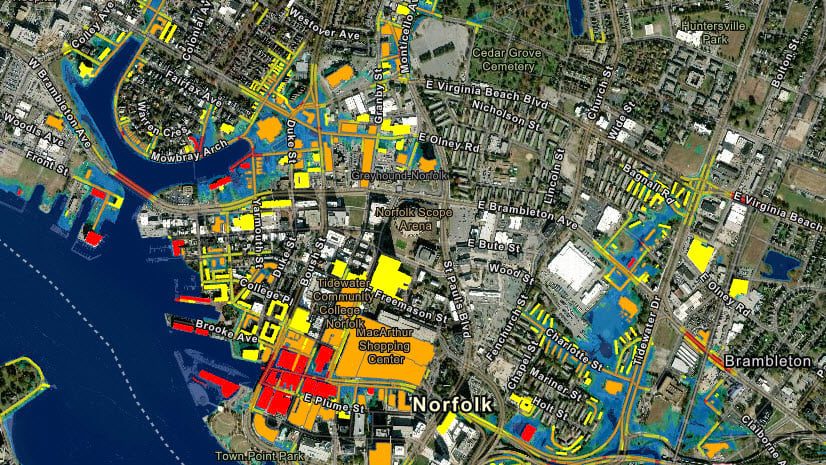
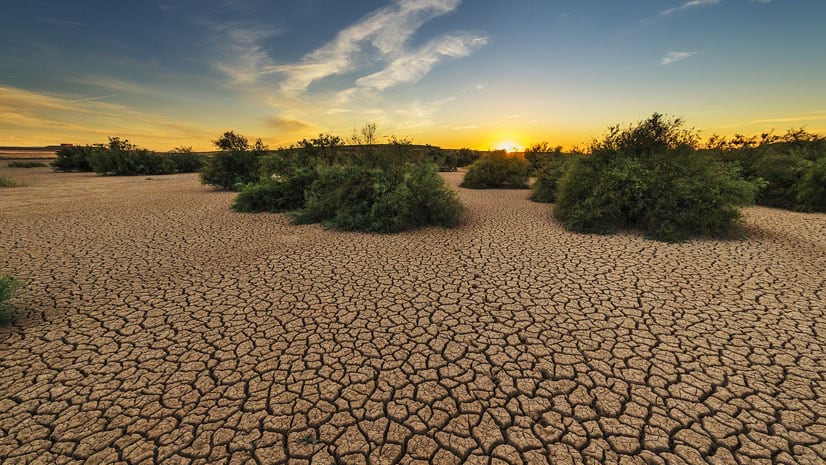
Natural hazards have been getting more devastating and more frequent in the past 50 years. According to the World Meteorological Organization, the number of disasters has increased by a factor of five. Natural hazards can cause millions of dollars in damages to buildings and agriculture, but more gravely they can cause injuries and fatalities. Depending on where you are located in the U.S., the severity of your risk as well as the type of hazard vastly differs.
If you have ever wondered how at risk your community is to natural hazards, the recently released National Risk Index (NRI) from the Federal Emergency Management Agency (FEMA) has got you covered. The National Risk Index is an online mapping application that visualizes natural hazard risk metrics based on 18 natural hazards, expected annual losses from natural hazards, social vulnerability, and community resilience. With this tool, you can discover a holistic view of community risk to natural hazards. The NRI layers, maps, and apps can now be found in ArcGIS Living Atlas of the World.
Newly released layers include:
- National Risk Index Counties
- National Risk Index Census Tracts
- National Risk Index States Expected Annual Loss
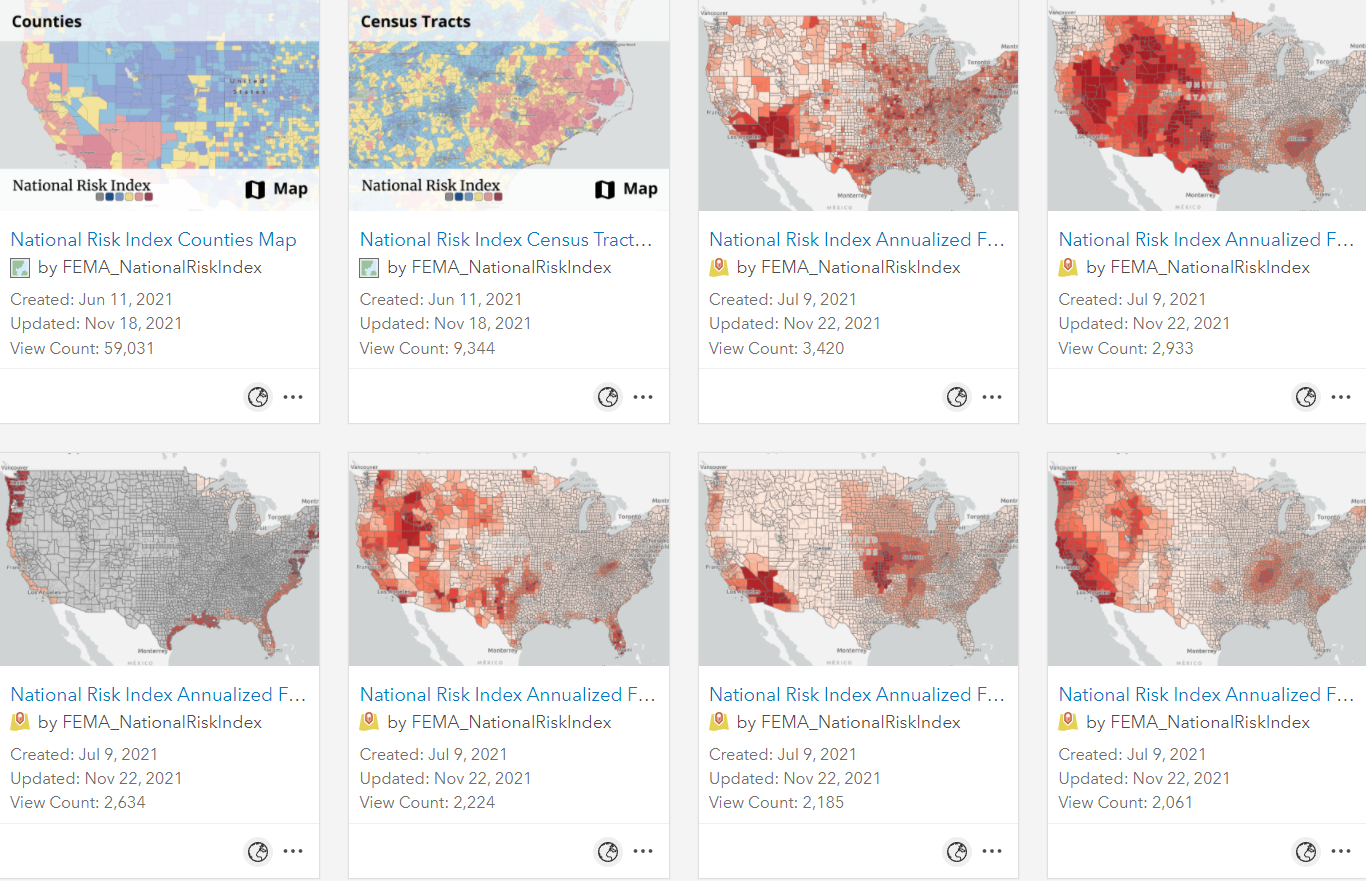
These newly released layers are an excellent source for any map maker trying to determine what kind of natural hazard risk are prevalent in their community, what kind of natural hazards are prominent, and what the kind of losses would be expected for people, buildings, and agriculture. These layers enable users to analyze their own data in conjunction with the NRI data, as well as being able to create captivating maps that showcase natural risk in their communities.
Understanding the National Risk Index
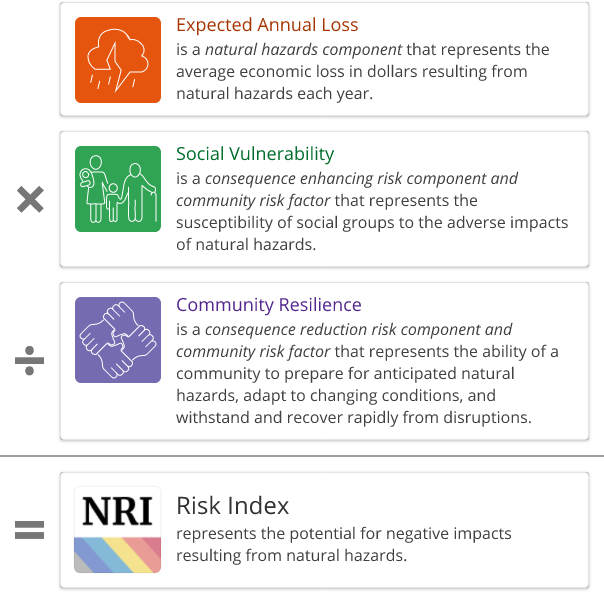
In the National Risk Index, risk is defined as the potential for negative impacts as a result of a natural hazard.
The risk equation behind the Risk Index includes three components:
The datasets supporting the natural hazards and consequence reduction components have been standardized using a min-max normalization approach. The dataset supporting the consequence enhancing component was acquired in a normalized format, allowing for easy incorporation into the National Risk Index risk calculation. Using these three components, a composite Risk Index score and hazard type Risk Index scores are calculated for each community (county and Census tract) included in the Index.
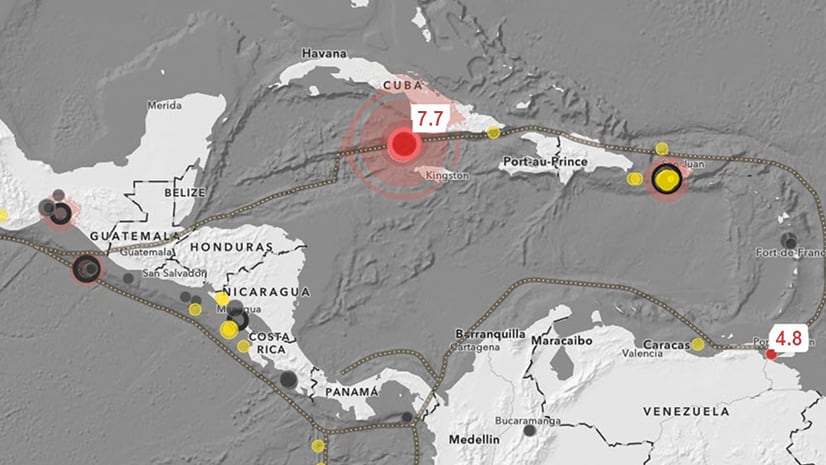
Each community has a composite Risk Index score and up to 18 hazard type Risk Index scores (e.g., Tornado Risk Index score). A composite Risk Index score measures the relative risk of a community based on all 18 natural hazards included in the Index, while a hazard type Risk Index score measures the relative risk of a community for a specific hazard type.
For comprehensive details about how risk is calculated for the Risk Index, see the National Risk Index Technical Documentation.
- Learn about the scores and ratings provided by the Risk Index
- Learn about how the Risk Index was developed
How the National Risk Index Can Help
- Updating emergency operations plans
- Enhancing hazard mitigation plans
- Prioritizing and allocating resources
- Identifying the need for more refined risk assessments
- Encouraging community-level risk communication and engagement
- Educating homeowners and renters
- Supporting the development and adoption of enhanced codes and standards
- Informing long-term community recovery
The National Risk Index Audience
The Index is accessible to anyone interested in mitigation or understanding a community’s natural hazard risk, including:
- Public employees
- Local officials
- Research institutions
- Property owners
- Community planners
- Real estate professionals
- Academia
- Insurance community
- Homeowners and renters
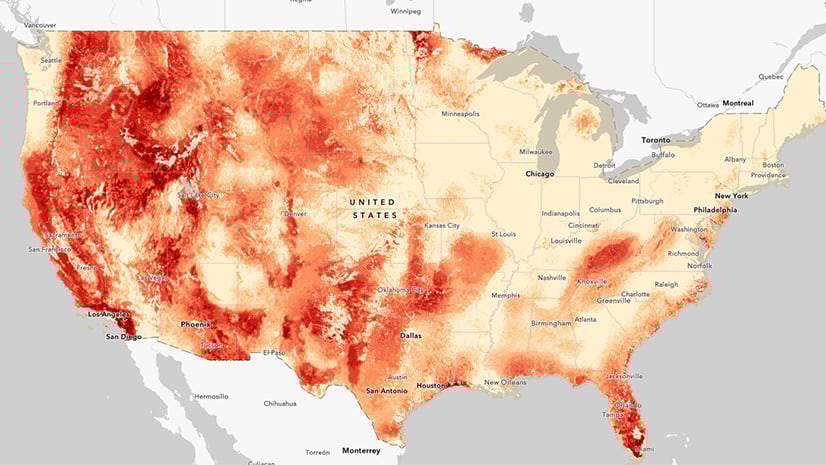
FEMA National Risk Index Web App
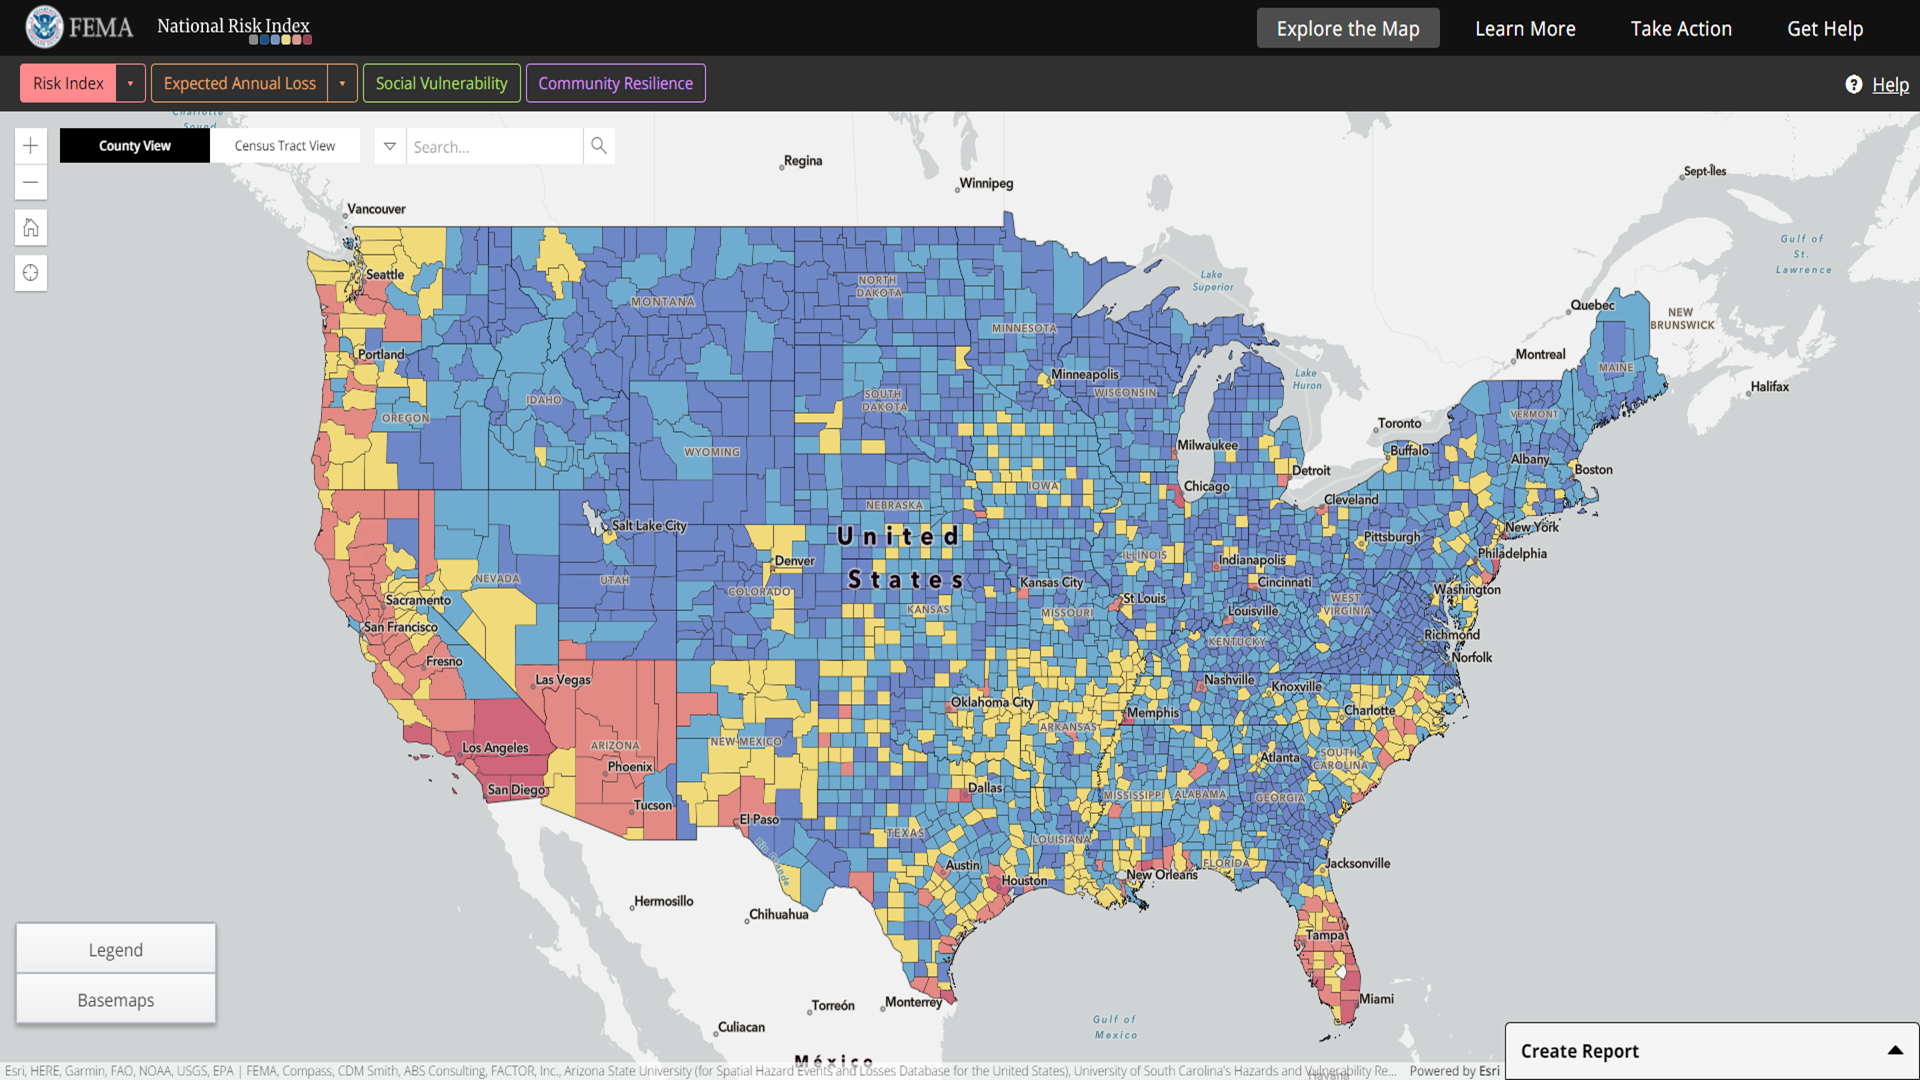
This app created by FEMA allows you to explore the NRI throughout the United States. Explore the overall risk index, the Expected Annual Loss, Social Vulnerability, or Community Resilience factors at either the county or tract level. This ready-to-use app requires no set up, so it is perfect for getting right into the data and seeing how natural hazard risks affect your community. FEMA has created a robust pop-up in the web app that shows a plethora of information, such as ranking the hazard scores of your selected area to its state and nation, as well as all of the scores/ratings of each of the 18 individual hazard types.
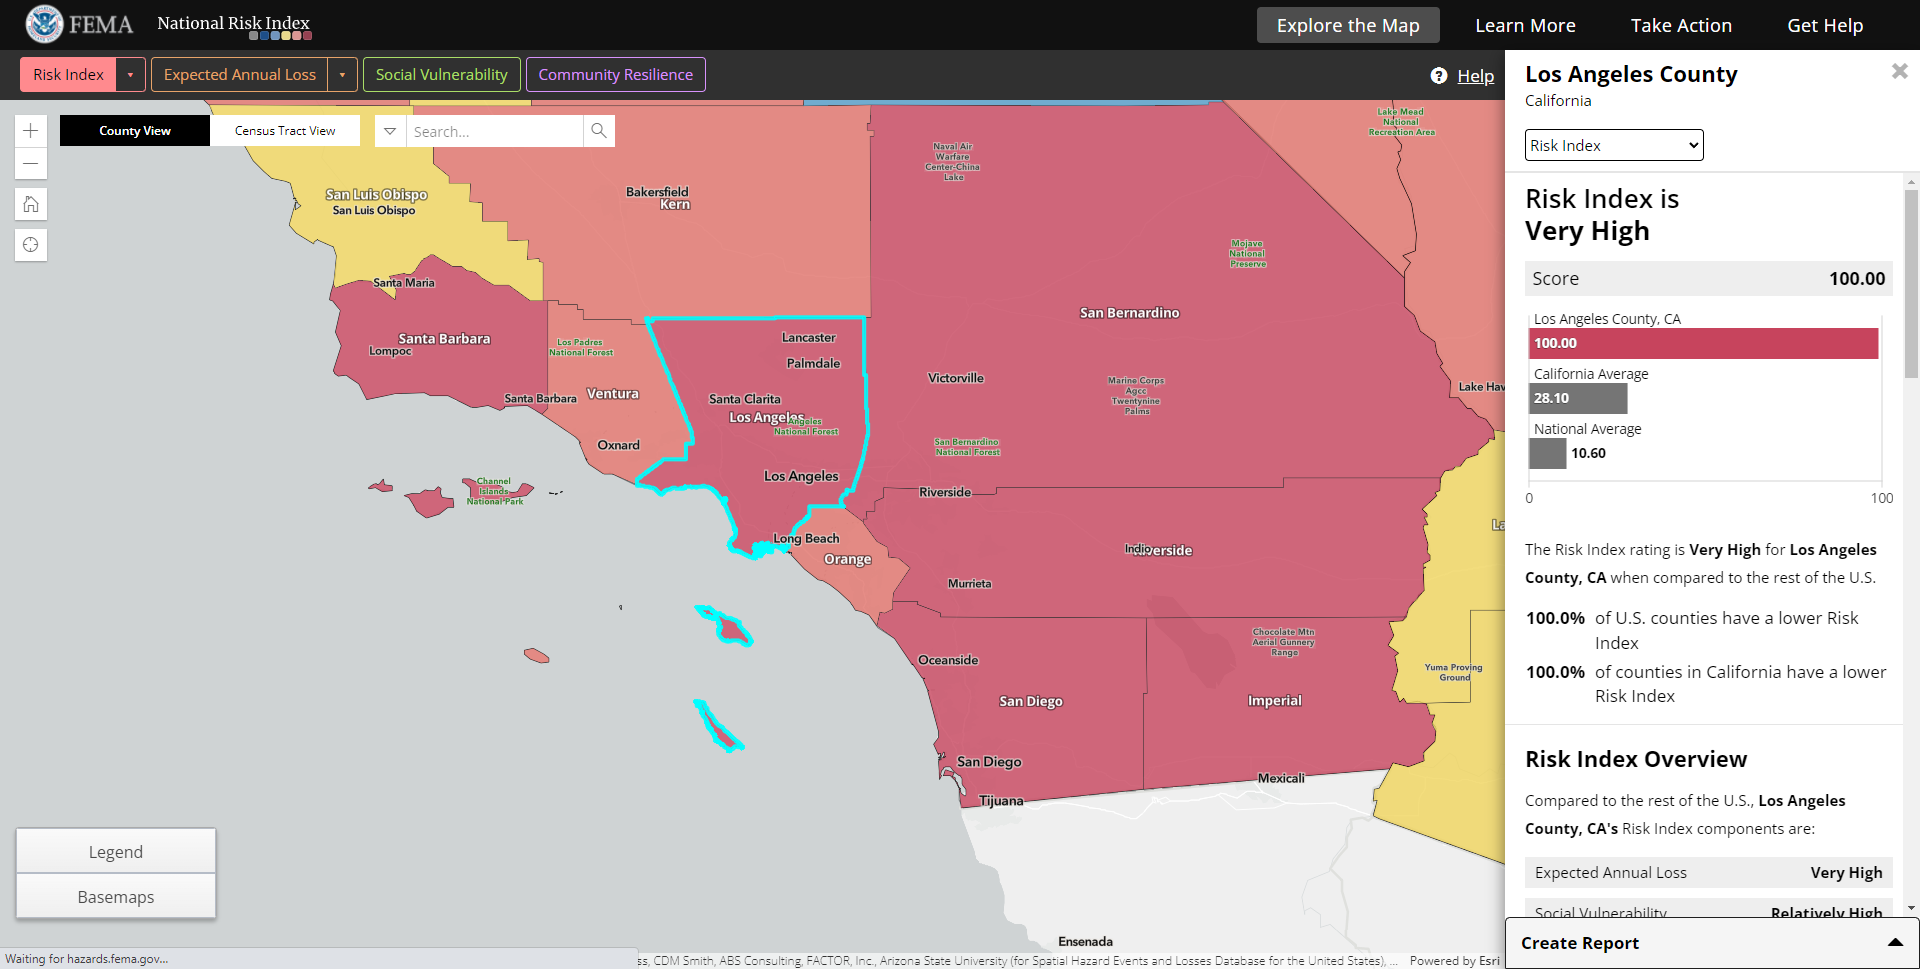
Additionally, FEMA’s NRI web app also incorporates a Create Report function, that creates a neatly designed, yet detailed report of your selected geography, full of charts, maps, and tables. See an example of report for Los Angeles County, California.
Learn more by clicking on the map or selecting a hazard type.
For a helpful guide on how to use the National Risk Index Map, follow along with this User Guide.
Map this data
Create your own maps in ArcGIS Online, Pro, and create compelling Dashboards, StoryMaps, and other Instant Apps with the National Risk Index to evaluate your community’s natural hazard risk. Share your work back with ArcGIS Living Atlas of the World.
Thank You, FEMA!
For all of the hard work and research into developing the National Risk Index, for creating this data in ready-to-use GIS format, to creating a stellar web app that showcases the NRI data as well as contributing this data to ArcGIS Living Atlas of the World, a huge thank you! The NRI data is really well documented, and it enables people to easily to evaluate their natural hazard risks in their community.
NRI related text throughout this blog is sourced from FEMA’s National Risk Index for Natural Hazards. For any NRI related questions, please email FEMA-NRI@fema.dhs.gov.

Article Discussion: