We hear a lot about the increasing frequency and intensity of wildfires across the U.S., especially in California. The Golden State has experienced three of the worst wildfires in state history – in just two years. Some of the uptick in frequency and intensity has to do with shifting environmental conditions (e.g., rain and temperature), but also the development of otherwise uninhabited areas – areas that are more difficult to contain due to their remote nature.
Every few years the US Forest Service analyzes the potential risk of wildfire across the U.S., in terms of the threat of a fire breaking out that would be difficult to contain. While this map does not update in real-time as local weather and climate changes occur, it does provide useful information to fire suppression agencies along with the insurance sector for assessing baseline risk.
The Living Atlas of the World has provided this data for several years, and we have just updated it to the most current 2018 analysis.
So, how has wildfire risk changed across the country since the 2014 analysis? Here we can look at it in two different ways:
Using a swipe tool in ArcGIS Online

Running a difference analysis on the two times using the Raster Analysis tools in ArcGIS Pro.

Besides the classified data available from USFS, there is a continuous data file. Using the Cell Statistics geoprocessing tool, the difference was calculated between the two years, and the results were classified into four classes (slight better/worse and much better/worse).
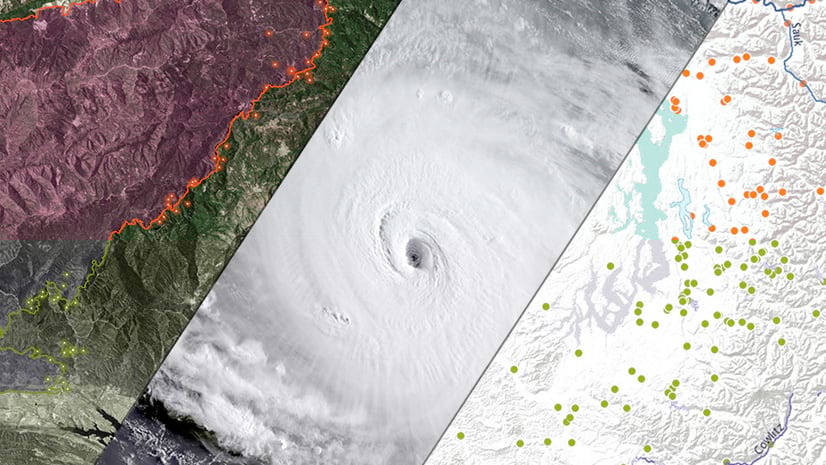
By adding in the USA Wildfire Activity data from the Living Atlas, we can see how these areas or worsened conditions are also associated with active or recent wildfires over the past year. Interestingly, most of the current fires (as of the blog publication) are associated with worsened conditions.

As are the three biggest fires of the year (Mendocino Complex Fire, Camp Fire, and Carr Fire).

These updated 2018 wildfire risk maps, when paired with the USA Wildfire Activity and MODIS Thermal Activity real-time data services, will hopefully be a valuable resource for monitoring active fire areas along with the potential for destructive wildfire events across the U.S.
Do you have questions or comments about this blog? Post them in our GeoNet.


Commenting is not enabled for this article.