Valuable new information for building greater climate resilience was released today by the U.S. government. The 5th National Climate Assessment (NCA5), mandated by Congress, provides a detailed accounting of the latest understanding of climate trends and potential impacts in the United States. And I mean detailed: it’s 2,000 pages.
For those who just want to dip their toes into the pool of climate change, may I suggest this new resource that was released with NCA5 that uses maps to highlight some of the key findings?

An atlas of climate maps…thank you U.S. Global Change Research Program and NOAA! It’s officially called the NCA Interactive Atlas. Right now there’s about 60 maps, showing how different patterns of temperature and precipitation may change for each county in the U.S. More will be added over the next few months. Each map collection shows a variable, such as extreme precipitation, for different Global Warming Levels. This approach is time irrelevant. It is focused on our choices. How bad will things get at a local level if we let the planet warm 2, 3, or 4 degrees Celsius?
Three degrees of average global warming could translate into summer days that are 10 degrees warmer than a decade ago. We’re at 2 degrees F average global warming now. The maps plot the changes relative to the recent past, which gives us a sense of the speed and intensity of climate change.

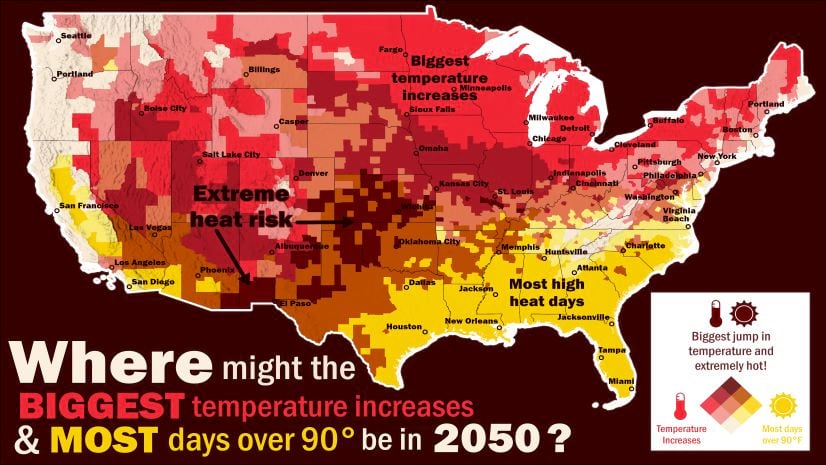
All of the maps and layers are also available in ArcGIS Living Atlas, so you can explore patterns yourself, or even analyze potential impacts in your county. Here’s a map that I made that looks at the intersection of changes in extreme precipitation and temperature. Two really interesting stories emerge.
If we look at changes in single-day events, such as the hottest day of the year (yellow) and rainiest day of the year (blue), the northern U.S. will experience the combined greatest change in both variables (red).
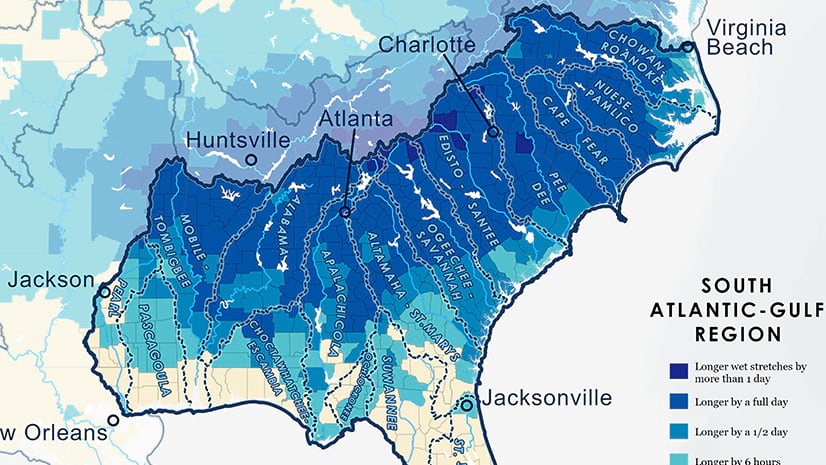
But if we look at the relative change in the total number of extreme heat and precipitation days, the Southeast is in for a bad time.
There’s also a StoryMap that helps put some of these maps into context, along with “key takeaways” that are copied directly from NCA5.
The data here is also hot off the presses, developed specially for NCA5. It uses high resolution climate models that are optimally blended to provide the most accurate estimates for the United States. This data will soon be making it’s way into other initiatives, such as the Climate Mapping for Resilience and Adaptation portal.

Article Discussion: