By Aileen Buckley, PhD, Esri Research Cartographer
With the addition of high-resolution Airbus data (approximately 24 meters) to the Terrain layer in ArcGIS Living Atlas of the World, it is now easier to find some of the world’s strange and wonderful landform features. In this blog post, I take a look at one of my favorite finds and provide a few hints on how I mapped it. For other interesting terrain revelations, keep watching this ArcGIS blog.
Geography
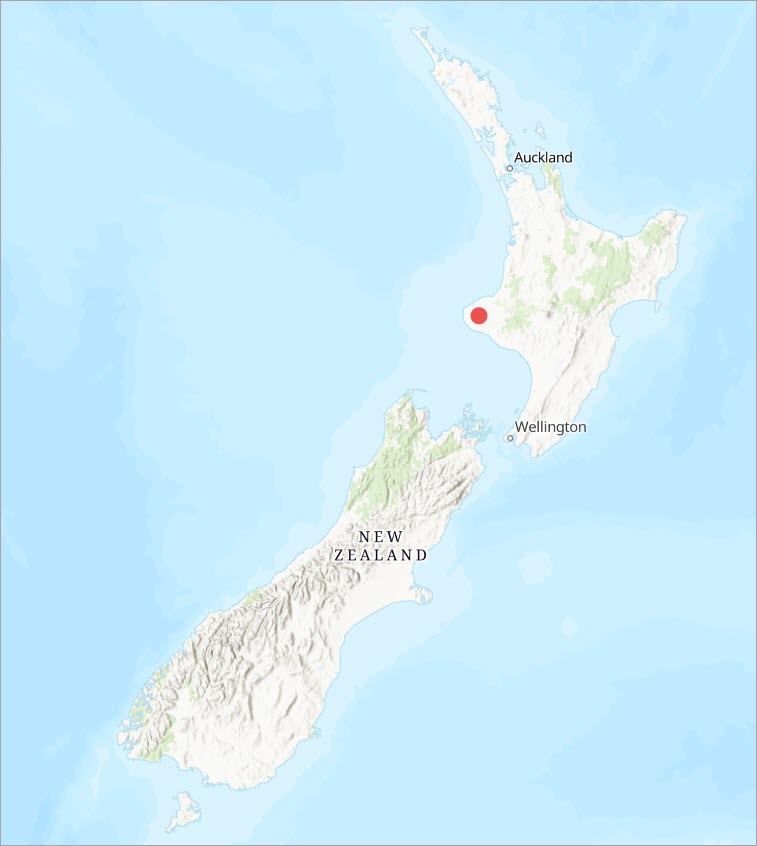
Mount Taranaki is “one of the most symmetrical volcanic cones in the world”, according to Taranaki Civil Defence. Situated on the west coast of New Zealand’s North Island, the mountain stands at 2,518 meters (8,261 feet). On New Zealand’s north island, Mount Taranaki is second in height only to Mount Ruapehu, which peaks at 2,797 meters, or 9,177 feet, and was immortalized (along with Mount Ngauruhoe) as Mount Doom in Peter Jackson’s Lord of the Rings trilogy.
Toponomy
According to GNS Science, the Māori gave the sleeping active stratovolcano the name Taranaki; tara means “mountain peak” and naki, derived from ngaki, which means “shining” or “glistening”, refers to the mountain’s often-snow-capped peak. GNS Science adds that in 1770, “Captain [James] Cook named it Mount Egmont after John Perceval, 2nd Earl of Egmont, a former First Lord of the Admiralty who had supported the concept of an oceanic search for Terra Australis Incognita.” Since the 1930’s, Taranaki has been known by its ancient name. Land Information New Zealand provides a wonderful story about the naming of the mountain.
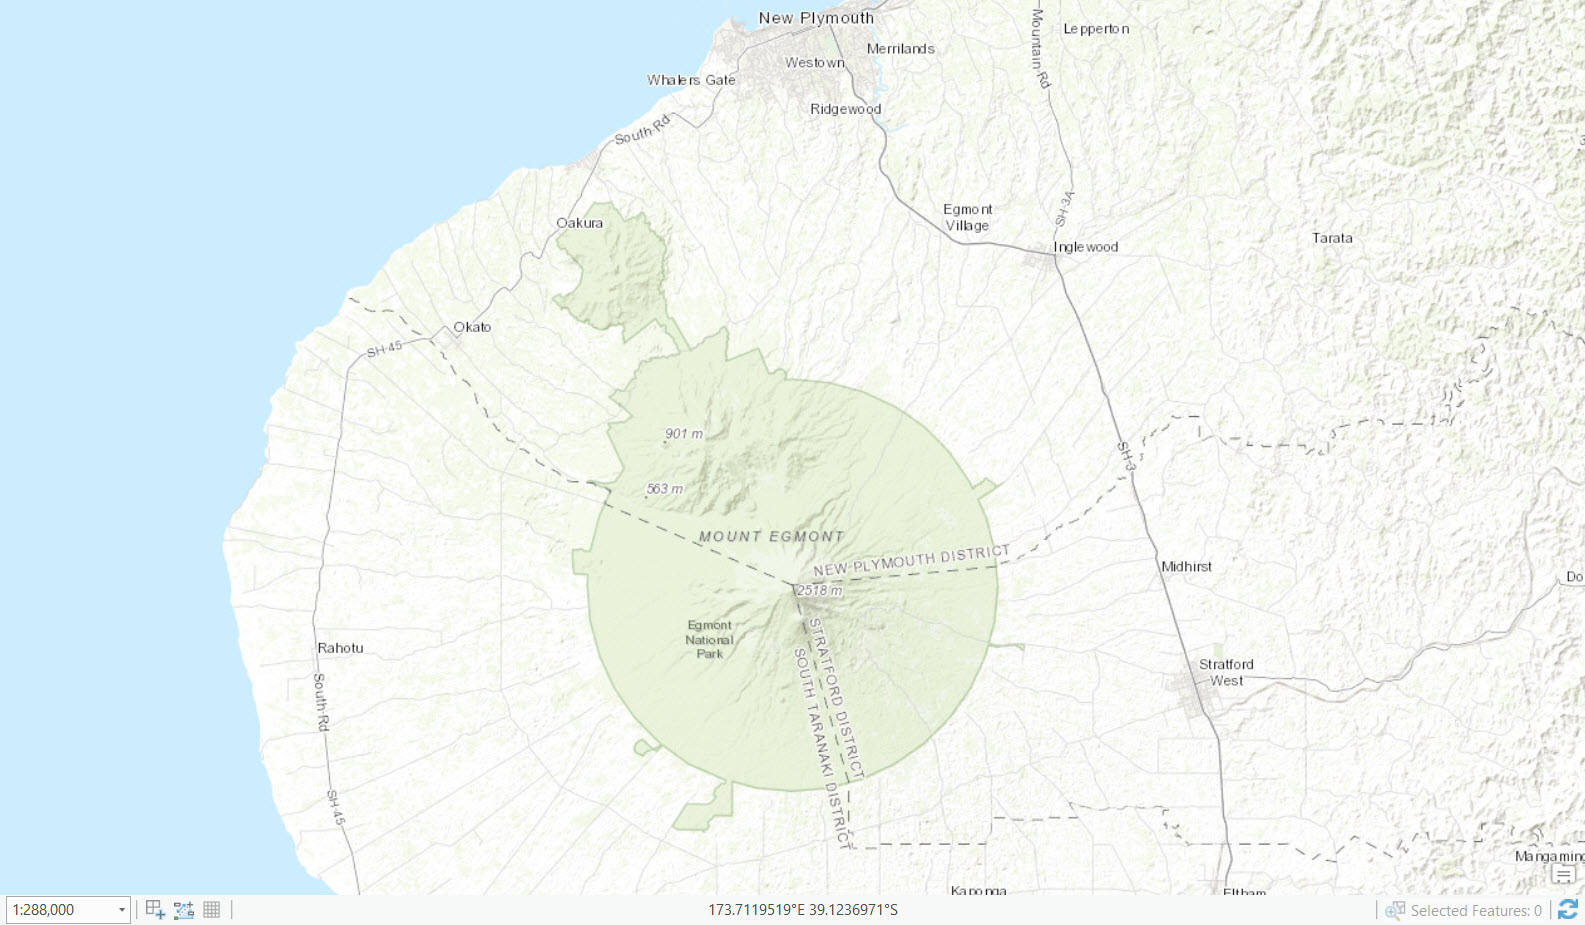
The land around Mount Taranaki was set aside for a national park which was established in 1900. Although the park retains the name Egmont, its crowning jewel is Mount Taranaki, which is often described as “New Zealand’s most climbed mountain”, according to New Zealand.com. The distinctive perimeter of the park mimics and also exaggerates the symmetry of Mount Taranaki through its unusual circular shape.
Volcanism
According to Wikipedia, Mount Taranaki started forming about 135,000 years ago. Over the last 9,000 years, minor eruptions have occurred about every 90 years on average, with major eruptions every 500 years, the last of which occurred around 1655. Around 1755, an eruption sent a pyroclastic flow down the mountain’s northeast flanks. Its most recent volcanic activity, in the 1850s or 1860s, produced a lava dome in the crater that then collapsed down the side of the mountain.
In addition to its striking symmetry, Mount Taranaki is unusual because the cone of the volcano has collapsed at least five times, an event that, GNS Science says, few volcanoes have undergone more than once. Associated with Mount Taranaki’s eruptions, the breadth of historical landslides, lava, and pyroclastic flows has extended from 7–40 kilometers from the cone, even reaching the present-day coastline.
Although volcanic eruptions are notoriously erratic in their frequency, GNS Science says some researchers predict that “significant seismic activity is likely again in the next 50 years”. Taranaki Civil Defence notes, “Recent research (2014) estimates an 81% probability of at least one eruption by 2065.”
Maps
We can learn even more about Mount Taranaki through maps of the area. The ArcGIS World Topographic map is a good place to start.
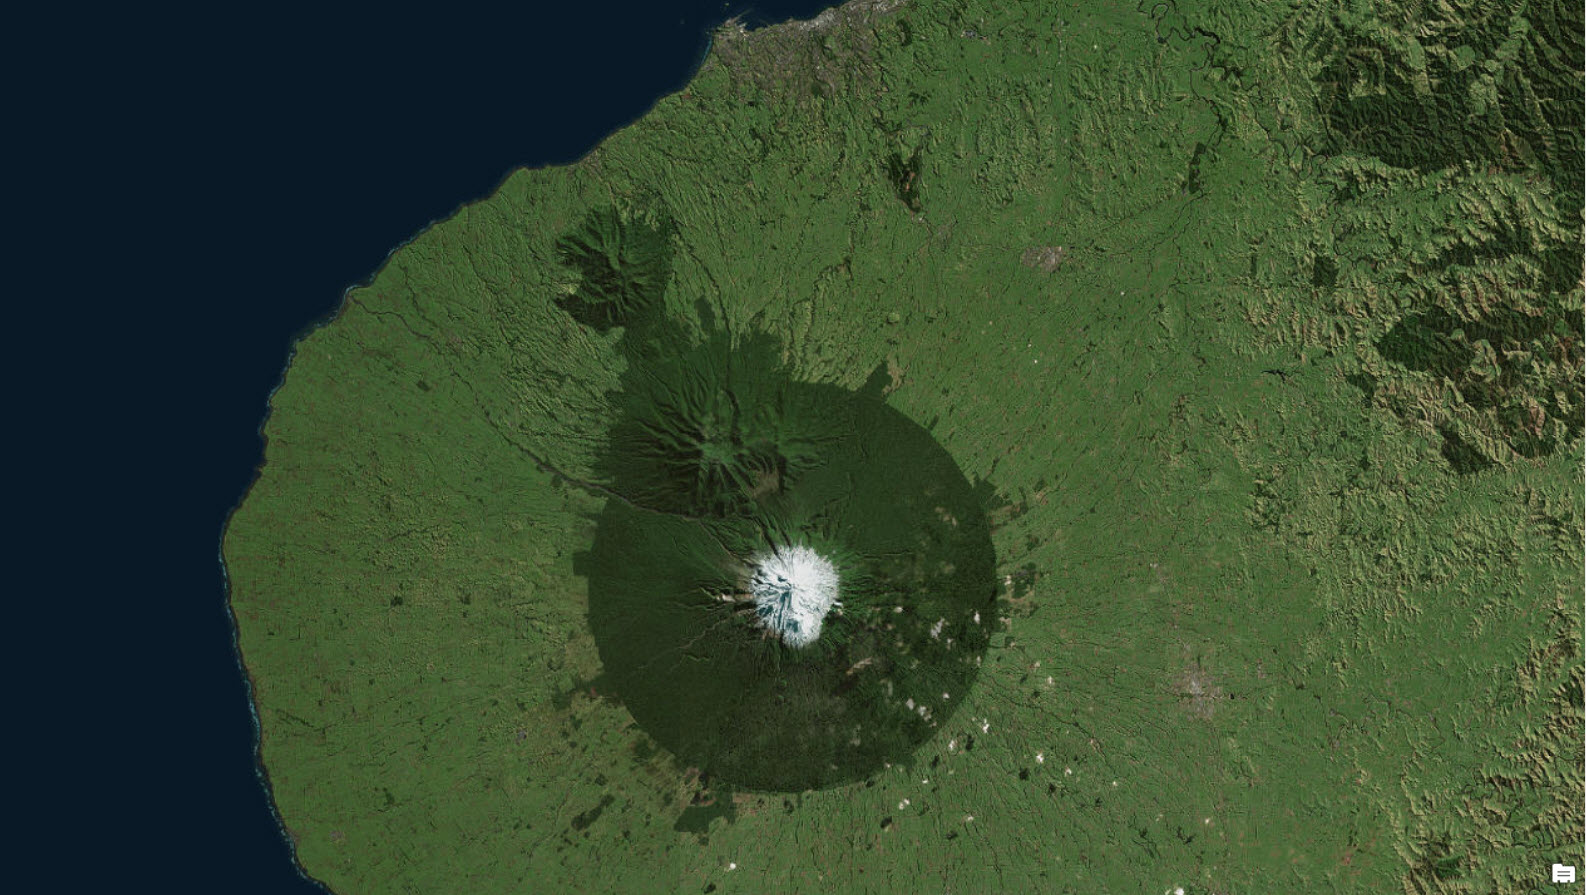
An image map, made using the Imagery basemap in ArcGIS Pro, shows the snow-capped peak as well as the wooded extent of Egmont National Park. The park encloses Mount Taranaki and two smaller mountains to the northwest—Pouakai Ra (1,400 meters or 4,593 feet) and Kaitake Ra (684 meters or 2,244 feet).
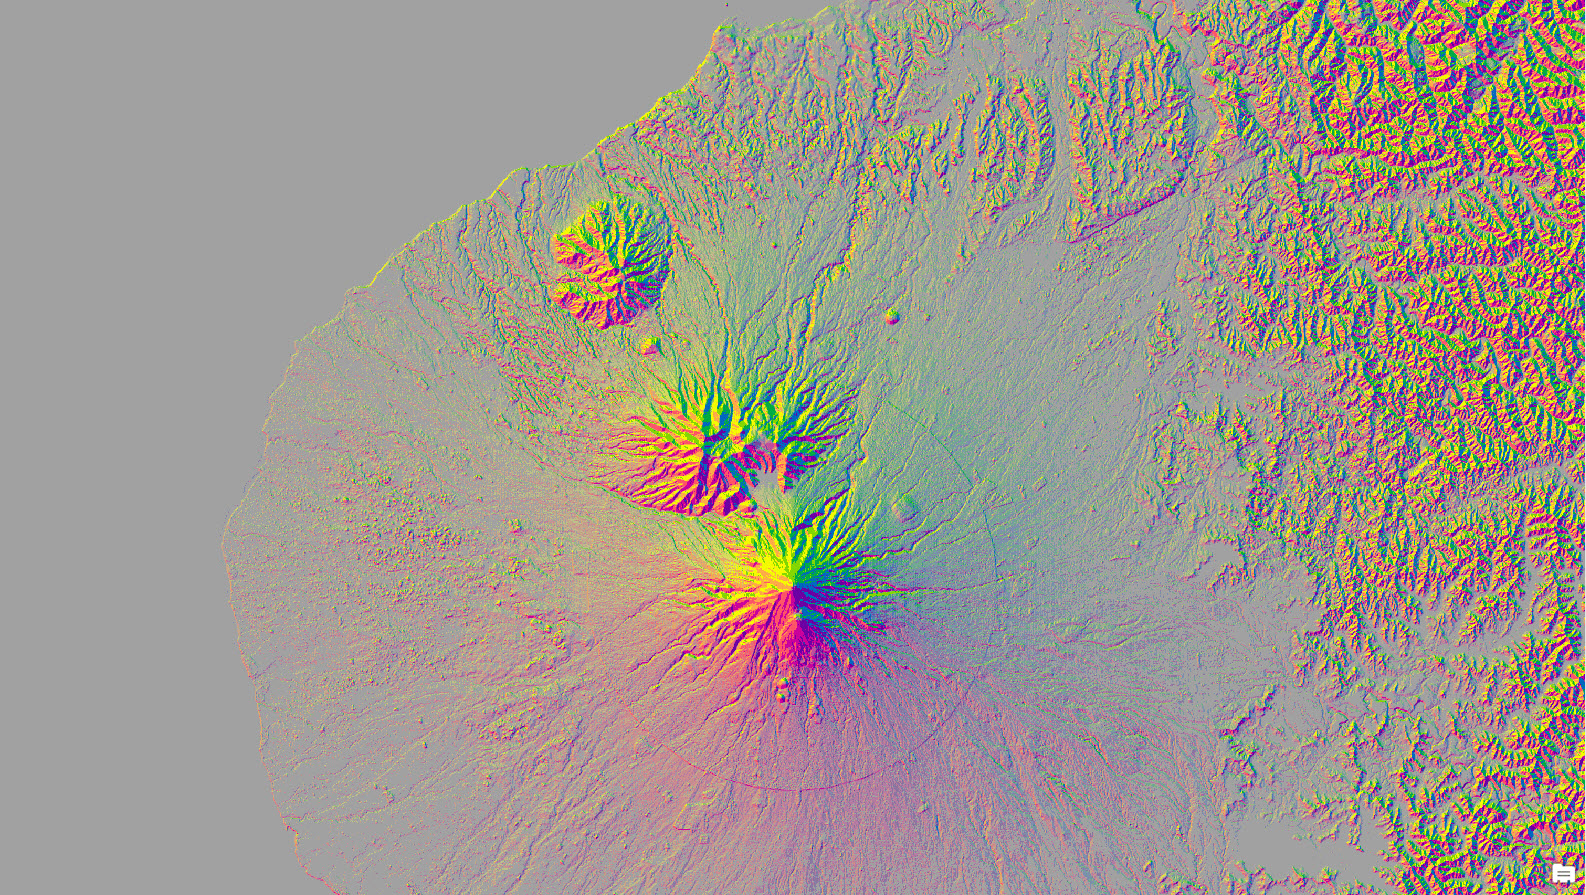
An aspect-slope map clearly shows the smaller mountains to the northwest, and it illustrates just how symmetrical Mount Taranaki is in all other directions. This map was created in ArcGIS Pro using the aspect-slope function. The data was from the Terrain imagery layer in ArcGIS Living Atlas of the World. For step-by-step instructions on how to use raster functions with the Terrain layer, see this ArcWatch tip.
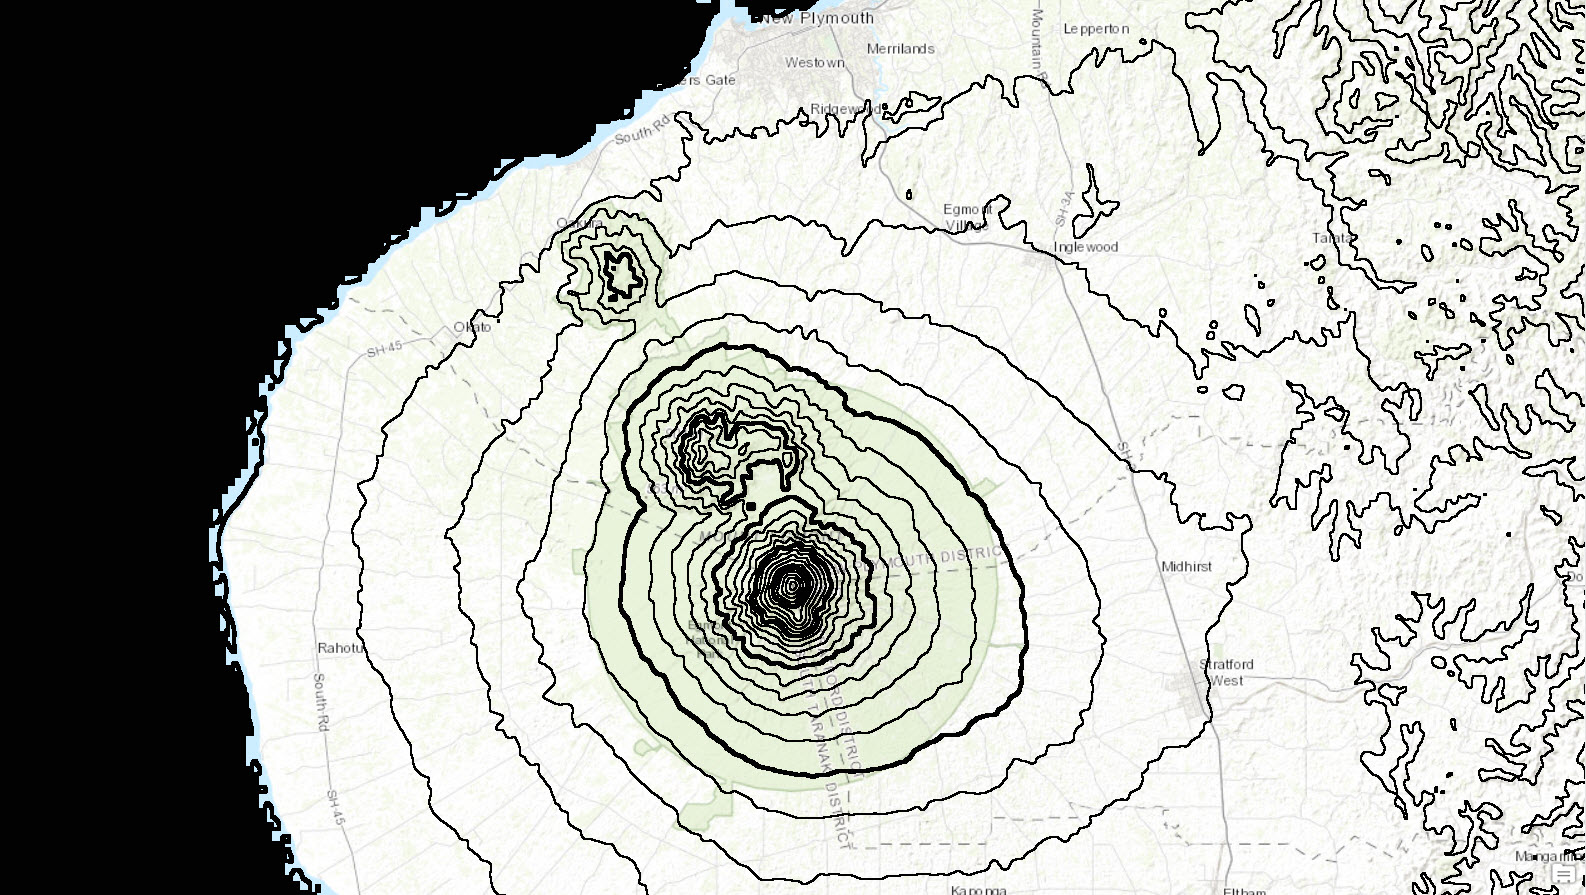
Contours generated using the contour function in ArcGIS Pro reveal the amazing symmetry of Mount Taranaki.
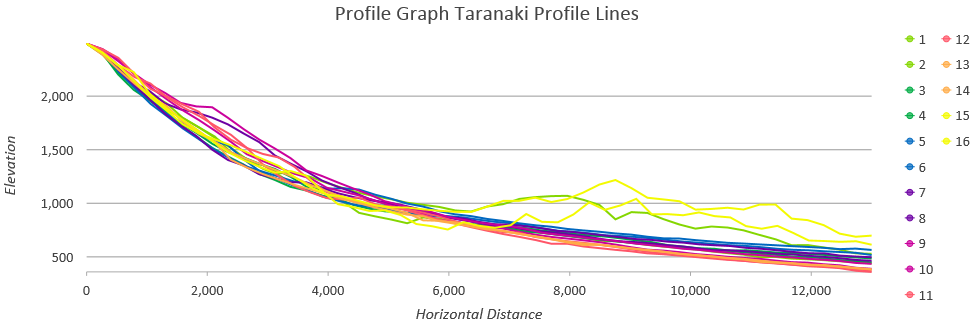
I generated profile lines from Mount Taranaki’s peak in the cardinal (N, E, S, W), ordinal (NE, SE, SW, NW), and secondary intercardinal directions (for example, NNW) using the COGO Traverse tool.
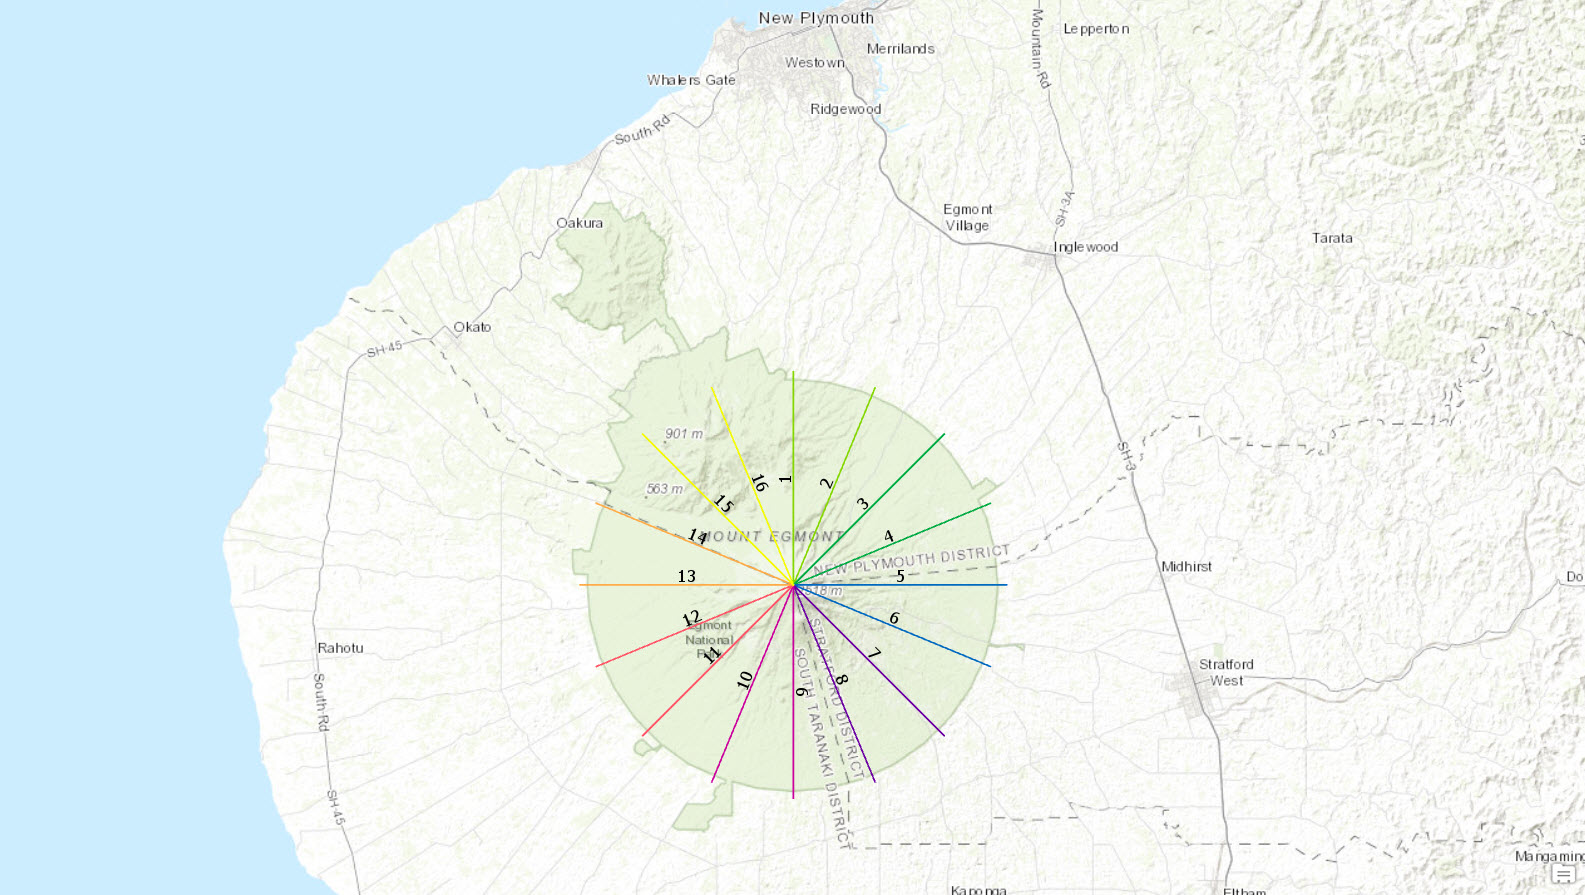
I then created a profile graph to show that the slopes in all but the northwesterly direction were nearly identical.
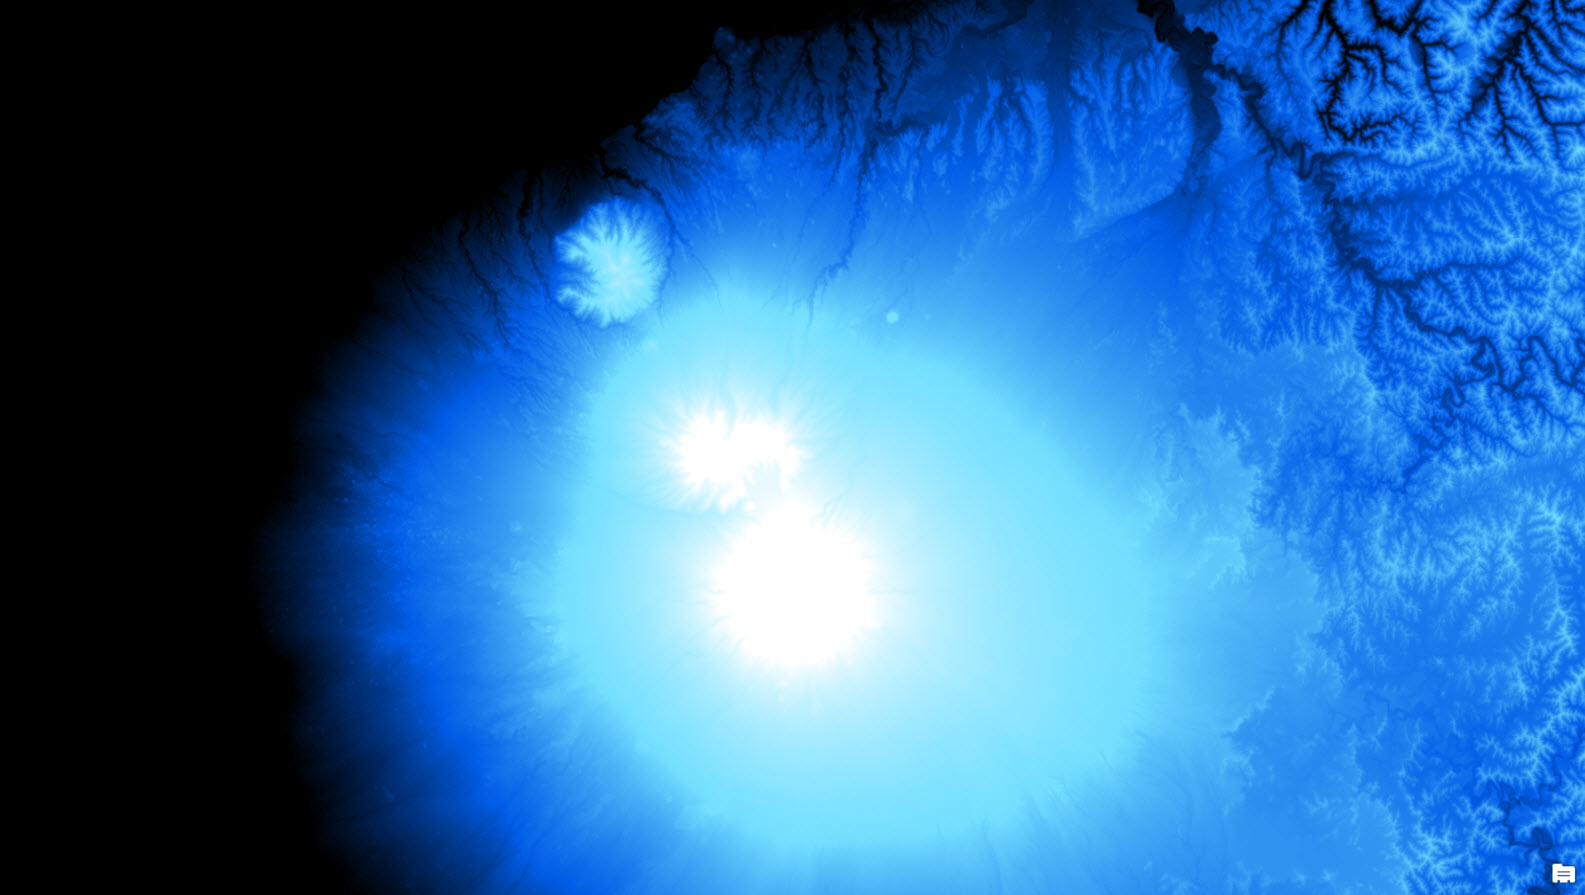
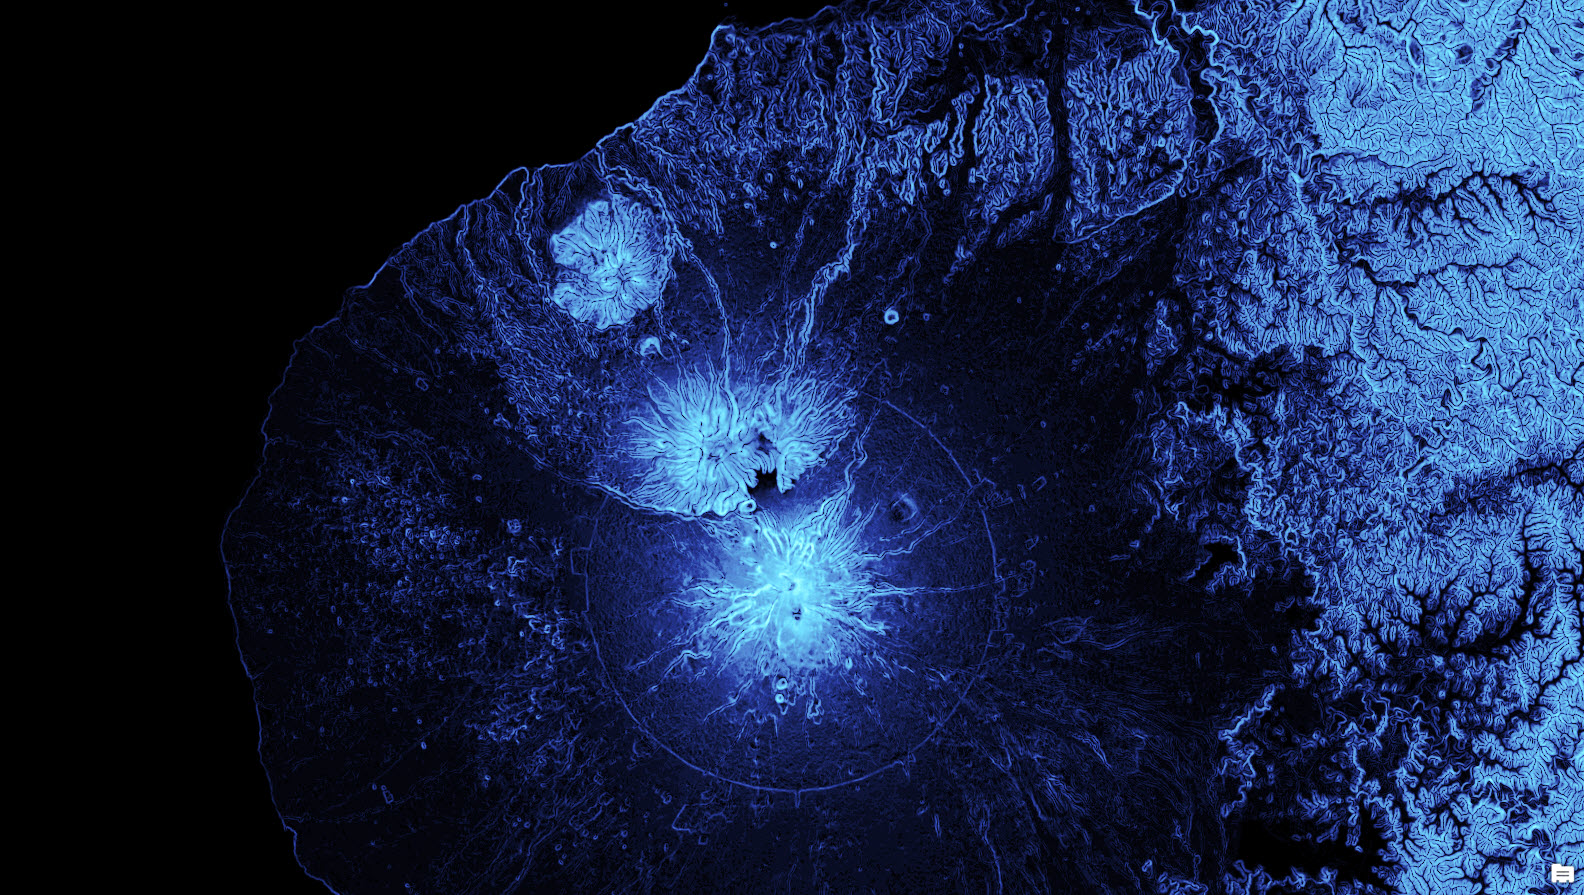
Instead of using a typical elevation-tinted hillshade, I decided to explore the terrain surface using a color scheme ranging from white (highest) to black (lowest) and including a range of blue tones  and a Percent Clip stretch. All maps made from here on out used the DRA feature for the Statistics on the Symbology pane. This revealed the hydrologic structure of the area.
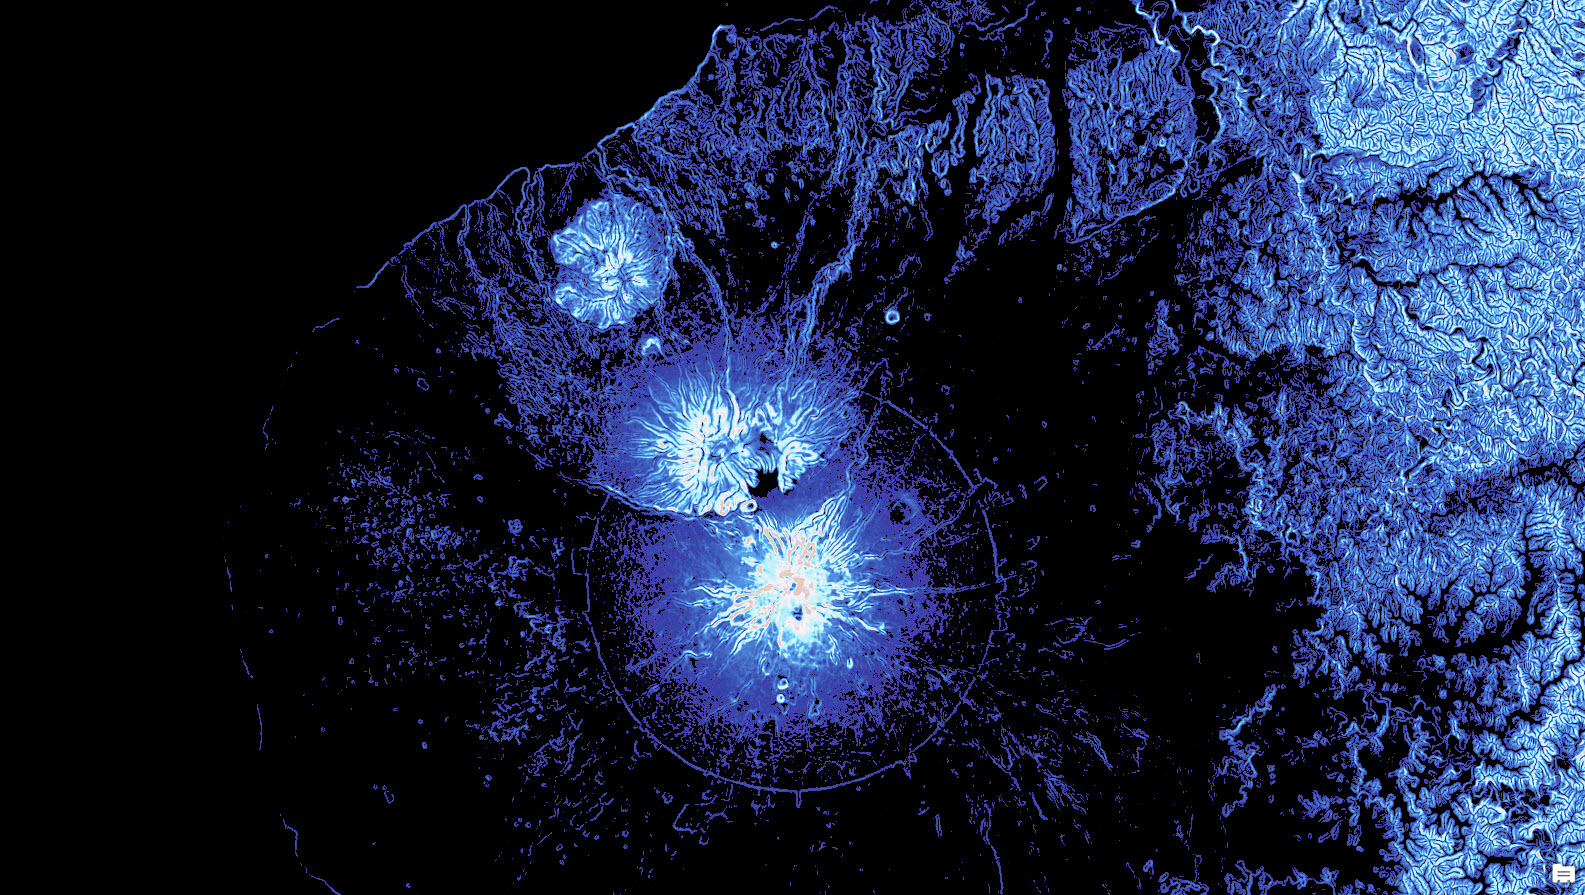
I then decided to explore the area by mapping the slope to accentuate the gullying off the volcano. I again modified the color scheme  and used a Minimum Maximum stretch, which resulted in the map below.
This reminded me of a visit I made to the Oregon Coast Aquarium, where I was mesmerized, as were most other visitors, by the jellyfish exhibit.

Image source: https://www.natgeokids.com/uk/discover/animals/sea-life/jellyfish-facts/
This got me to looking up other jellyfish images . . .

Image source: https://www.futurescienceleaders.com/surrey1/2018/11/14/the-immortal-jellyfish/
. . . which led me to making this map by modifying the color scheme  , still keeping the same stretch.
By now, I was fascinated by the maps and intrigued by the process. I thought I could use a similar approach to find other surprising terrain features on earth. That is how I conceived of this blog series, Terrain Revelations. I want to share it with you in the hopes that you will also find it interesting and you will learn useful ways to visualize terrain in different ways to reveal some of its interesting characteristics.
Watch for upcoming blog posts to see what else I have found! Spoiler alert: Some of these are noted in my blog post to introduce Terrain Revelations.
Learn more about Mount Taranaki from the following sources:
- Taranaki Civil Defence, https://www.cdemtaranaki.govt.nz/taranaki-hazards/natural-hazards/volcanic
- GNS Science, Te Pū Ao, https://www.gns.cri.nz/Home/Learning/Science-Topics/Volcanoes/New-Zealand-Volcanoes/Taranaki-Egmont
- Wikipedia, https://en.wikipedia.org/wiki/Mount_Taranaki


Commenting is not enabled for this article.