Authors – Adam Jenkins (Esri US, Conservation Account Manager), Lara Salam (Esri UK, Data Curator)
I grew up in rural New Zealand and remember fondly spending time in the Otawa Scenic Reserve which is registered in the World Database of Protected Areas (WDPA). I built my first bivouac here as a boy-scout. I watched freshwater eels and the native nocturnal trout “Kokopu” by flashlight and marveled at the iridescent blue lights of the New Zealand Glow-worms (Arachnocampa luminosa) that lined overhangs along the grassy riverbanks. There was even a tight squeeze to explore an old cave which contained many long-legged Cave Weta (Gymnoplectron sp.). Natural places had a profound effect on me as a child and are a major contributing factor in how I approach the world and my work here at Esri. Also, read about Hollywood Dene in the UK near Whitley Bay in Lara’s blog.

Our planet needs protecting. Thankfully, recent trends suggest we’re starting to recognize this. Almost 15% of the Earth’s land surface and 7% of our oceans are covered by protected areas, according to the latest Protected Planet Live.
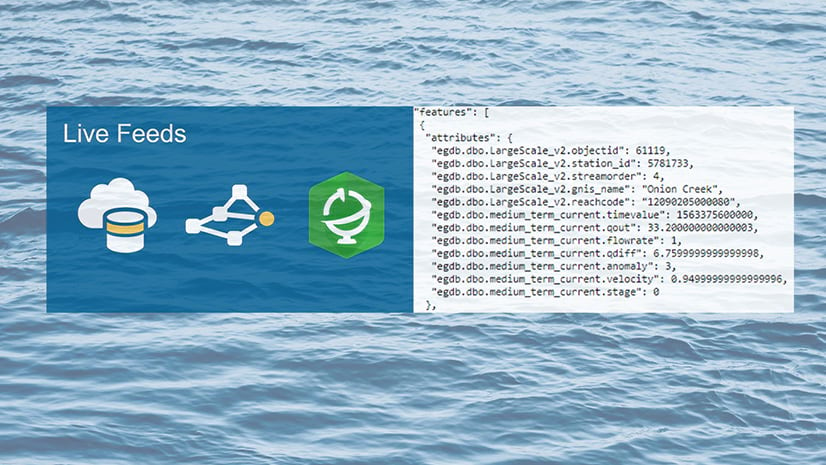
Knowing the location of these protected areas is crucial. Scientists, businesses, governments as well as other decision-makers and stakeholders need access to this information for development, planning and policy decisions. With this in mind, the UN Environment Programme World Conservation Monitoring Centre (UNEP-WCMC) has recently made the World Database of Protected Areas (WDPA) available in ArcGIS Living Atlas of the World. All ArcGIS users will now have access to this dataset in a GIS-ready format, which updates every month using our Live Feeds Methodology.

History of the WDPA
The WDPA is the most comprehensive global database of marine and terrestrial protected areas worldwide, with information on over 240,000 protected areas. It’s used to report to the Convention on Biological Diversity on progress towards Aichi Biodiversity Target 11, as well as reporting to the UN on progress towards the 2030 Sustainable Development Goals. The database was formally established in 1981. However, the mandate for the WDPA dates back to 1959 when the UN Economic and Social Council called for a list of reserves in recognition that they are ”valuable for economic and scientific reasons and also as areas for the future preservation of fauna and flora and geologic structures in their natural state.” The first UN List of Protected Areas, as it became known, was subsequently published in 1962.
How is the WDPA used?
The WDPA is not only used as a standalone database. Combining it with other key datasets is where its application becomes much more powerful. In the Integrated Biodiversity Assessment Tool (IBAT), it allows users to identify biodiversity risks and opportunity within a given area. In other online platforms such as Global Forest Watch and the Digital Observatory for Protected Areas, it can help improve the current understanding and management of the areas inside and outside of protected areas. In national-level planning, it can help inform future priority areas for protection. With the introduction of these datasets to Living Atlas, we hope that it can continue to help inform decisions for an expanding number of users and needs in this crucial time for people and nature.
“The Nature Conservancy (TNC) has long relied on the WDPA as both a reference and decision support dataset for prioritizing sites within and outside the network of protected areas. Having an up-to-date, accurate account of where protection designations exist in land and ocean environments allows TNC to examine species and ecosystem composition and condition of these areas, and ultimately how we grow the network.”
WDPA Full Dataset
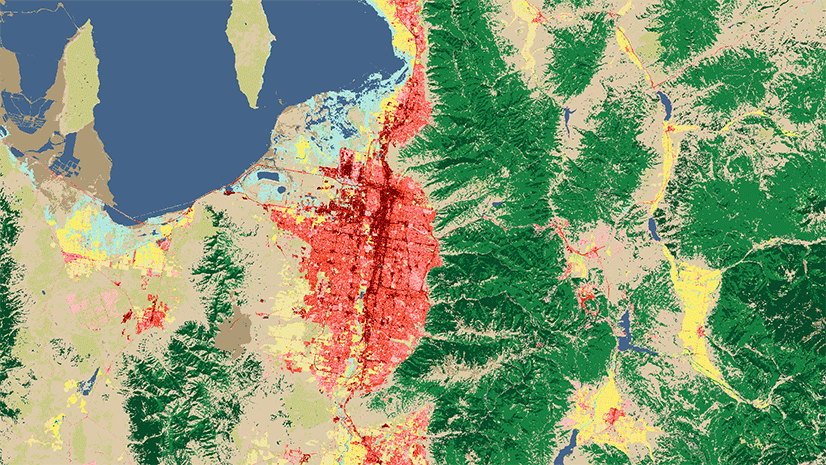
This is the full dataset. See every piece of protected land on the planet. Represented as a series of point and polygon features, the dataset is fully query-able and ready for analysis.
WDPA Government Protected Areas
This view of the data shows protected areas which are under the control of government bodies. Use it to explore the areas of our planet which are protected by local, regional and national governments.
WDPA Community Protected Areas
Next, this view contains areas where the protection is community-led. For instance, we can see the impact of community protected land in some of earth’s most vulnerable areas such as the Amazon rainforest.
WDPA Marine and Coastal Areas
Finally, there is a view containing the marine and coastal protected areas. Essential for organizations that focus on coastal and offshore landscapes, this view allows you to home in on these areas for your analysis.
Go Explore Protected Areas Near You

We used the Operations Dashboard to create an application that allows you to search and view the protected sites in your local area. Type your town into the search bar or pan around the map and browse the protected areas nearby. See what year they were given protected status, their size, and what ICUN protected category they are. Lastly, protected areas represent Earth Places that are important to us because nature inspires wonder in us and in our families.
Do you have a favorite Earth Place? If so, share it with us here.

Commenting is not enabled for this article.