ArcGIS Living Atlas of the World contains a wealth of layers, maps, and apps to help understand ecosystems, both in their distribution, structure, and function. Recently, two new map collections have been added to Living Atlas that, while developed separately, really demonstrate the power of GIS.
Land Cover and Vulnerability to Change by 2050
Initially released last year, six upgraded imagery layers developed in partnership between Esri and Clark Labs show how global land cover is predicted to change by the year 2050, along with an index indicating how vulnerable the area is to change due to human activity.

These data are modeled at three different scales: global, regional (continent), and country. Each model output is slightly different since the country model can be more fine-tuned to the drivers in that particular area. Regional and global models have more spatially consistent weights. Country-level is new to this release.
Above ground, below ground, and soil carbon biomass
The UN Environment Programme World Conservation Monitoring Centre generates some of the most authoritative information for conservation, and in a 2020 study they identified carbon biomass and soil carbon as an effective initial input for measuring overall biodiversity. Recently, they contributed their analysis of Above and Below-Ground Carbon Biomass and Above and Below-Ground Carbon Biomass and Soil Organic Carbon to Living Atlas as analytical image layers.

With the release of these new new analysis-ready layers we can examine the challenges and potential for achieving the 30×30 initiative nearly anywhere in the world.
Applying the Layers to Conservation
The 30×30 initiative seeks to conserve 30% of the planet’s surface by 2030. However, not all areas are equal – how do we begin to decide which sites are the most important to conserve? This can be a rather challenging question to answer. For example, the MOBI project used hundreds of data inputs, complex models, and hours of processing time to create a series of maps that aid conservation decision-making in the United States. This blog presents a highly simplified, exploratory workflow using two geoprocessing tools and two new layers in ArcGIS Living Atlas of the World: Above and below ground biomass carbon and the Land Cover Vulnerability Change 2050 – Country. Here, we can ask the question, “where do areas of high carbon biomass (and likely diversity) overlap with areas that are most vulnerable to being modified in the next 30 years?”

Applying the Science of Where
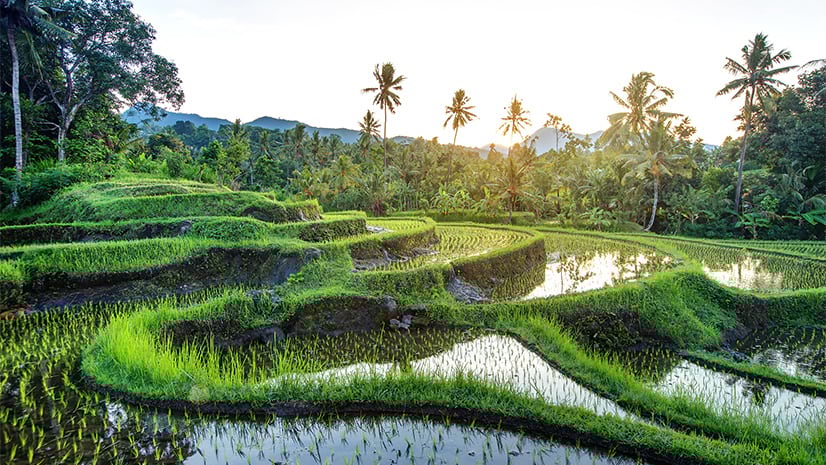
In a previous blog, land cover change in Indonesia over the past 30 years was explored using ESA’s CCI global land cover dataset. The ESA land cover dataset is also the starting point for the modeled biomass and 2050 predicted vulnerability index. In this analysis, we will continue to highlight Indonesia by examining the island of Java, which is highly vulnerable to land cover change and has a relatively low degree of protection. A series of spatial analysis tools in ArcGIS Pro can be used to find where high biomass and high vulnerability areas overlap, which are ideal candidates for protection.
For running the analysis, you can do it directly on the image service, or create a local copy of the biomass and vulnerability layers using Extract By Mask for the island of Java using the Indonesian Provinces layer in Living Atlas (filtered for Java). Since biomass and vulnerability are measured on very different scales, it is difficult to track what a ‘high’ value means in each dataset. To make an ‘apples to apples’ comparison, use Rescale By Function (linear option) to transform each variable to a 1 (for example, low vulnerability) to 10 (high vulnerability) scale.
Now that both variables are on the same scale, add them together using the raster function Plus. Locations with high vulnerability and high biomass will get a high score (maximum of 20). Areas with low vulnerability and low biomass will get a low score (minimum of 2). This new map shows how suitable each pixel is for conservation. Remember that our goal is to conserve areas with high biodiversity (biomass) and high vulnerability to land cover change (likely development).

While this map is informative, it doesn’t tell us which specific areas to conserve. To help answer that question, we can use a powerful new(er) tool – Locate Regions. This tool allows you to specify how much area you are interested in conserving, the desired shape of the area(s), and if you want to avoid areas already under conservation. We chose to identify five candidate conservation sites whose combined area would make up about ten percent of the island, and are about the same size as the other protected areas. The World Database of Protected Areas (WDPA) layer from Living Atlas was used as existing regions to avoid. A circular shape was chosen since they have proportionally more interior habitat.

The tool identified the five most suitable sites for conservation, balancing the desired shape (circular) against the best suitability score. Interestingly, all were located towards the western provinces of Java in Banten and Jawa Barat, which tended to have higher vulnerability and biomass scores. We can see that the resulting candidate conservation sites are roughly circular in shape and not located in areas of existing protected areas.

That’s it. With a proxy for biodiversity and an assessment of risk, and no downloads, we quickly (< 1hr) identified some candidate areas for conservation, taking into account biodiversity, risk of future development, and the area’s shape.


Article Discussion: