2022 introduced many improvements and new capabilities in ArcGIS Online and related products. Whether you’re making maps to fight wildfires, plan cities, increase resilience, respond to severe weather events, or improve your business, ArcGIS Online continues to evolve to better support your needs and activities.
It’s easy to overlook some of the changes and improvements that have occurred over the course of the past year, especially when you’re busy or don’t have time to explore all of the new capabilities. As a refresher, here’s an overview of what’s been delivered with links to all the details.
The Top picks and Other highlights are subjective, so view the entire update blog article to make your own picks and discover new features that you may have missed.
Quick links
There were three updates in 2022. Use the links below to jump to a specific one.

March 2022
Top picks
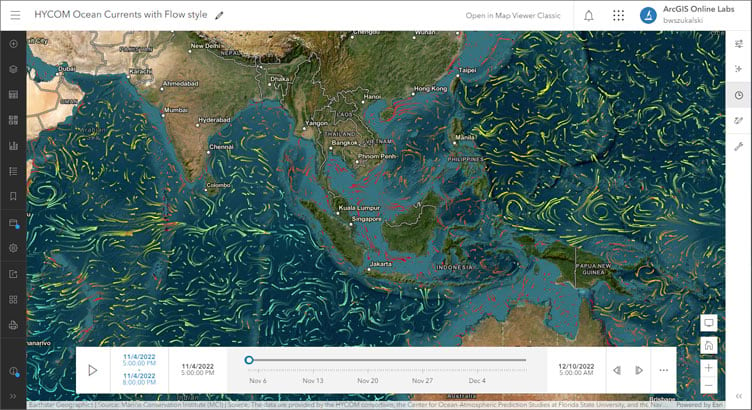
A new Flow smart mapping style was introduced, enabling you to display vector field data in imagery layers using animated streamlines and wavefronts to represent direction and magnitude.

The style is ideal for displaying ocean or wind currents as waves or streaming lines, in which the direction indicates the direction of flow and the length, color, and speed of the flowlines (or wavefronts) indicates the magnitude (or power) of the current.
Flow can be combined with other effects and blending to create an expressive animation. For example, you can combine Flow with the Bloom effect to make them pop, or use blending with other layers to add extra meaning. For more information, see Map Viewer introduces Flow.
Feature layers can now be duplicated, allowing you to configure styling, pop-ups, and filtering based on multiple values in the same map without affecting the configuration of the source layer. Nested group layers are now supported, simplifying visualization and review of map content.
Scene Viewer introduces support for voxel scene layers, enabling the visualization of atmospheric or oceanic data, underground models, or space-time cubes.
Other highlights
New Home page capabilities let you add images with links to your organization home page.
Time slider options can now be accessed from the options menu (…) on the time slider. They can also be accessed from Map Properties.
ArcGIS Dashboards introduces the ability to add elements using the add element option and selecting a location on your layout. Additionally, action configuration has been enhanced to be more intuitive by displaying all possible actions and allowing Dashboards authors to choose the ones they want.
Organization administrators can set up hierarchical categories for organizing members using characteristics like department, location, duties, and expertise. These categories can be used to filter members when performing management tasks.
Improvements were made for creating and scheduling administrative reports.
All the details
What’s new in ArcGIS Online (March 2022)
All March 2022 release articles

June 2022
Top picks
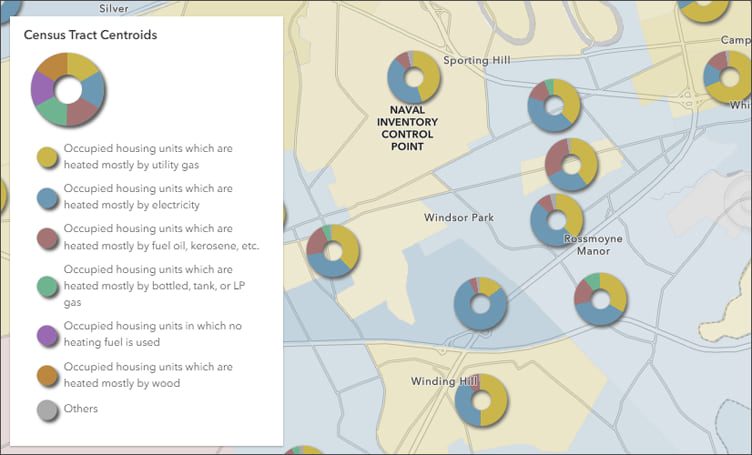
Map Viewer introduces two new smart mapping styles that allow you to visualize categorical numeric data as a pie chart. Use the Charts style to compare categories in a single feature and the Charts and Size style to compare categories in a single feature and the totals between locations.
Pie chart symbols can help answer questions such as what the proportions of categories are for each feature on a map, or comparing counts or other summary statistics between locations. Use the chart slider to set the chart to Pie or Donut.

The Heat Map style was improved to support faster and smoother effects. In addition, heat maps now support filtering, labels, and pop-ups. Filtered feature effects can also now be applied to emphasize areas that meet a certain criteria.
When using styles rendered using multiple attributes, chart element colors in pop-ups now automatically match the style colors.
Scene Viewer adds weather effects and 360 VR experiences. OpenStreetMap (OSM) 3D layers are also now available in ArcGIS Living Atlas for use in scenes, and feature thematic and realistic tree rendering.
Other highlights
You can now visualize and customize multilayer vector symbols for points, lines, and polygons in Map Viewer using symbol layers. Symbol layers allow you to style each component of a multilayer symbol independently.
Map Viewer adds support for saving feature layers and table layers as items in My Content. This allows you to preserve your layer or table configurations for reuse in other maps. Save saves changes to an existing layer or table item. Save as creates a new item in My Content from a layer or table in the map.
ArcGIS Experience Builder adds a 3D Toolbox widget to add 3D effects and analysis tools to both global and local web scenes.
All the details
What’s new in ArcGIS Online (June 2022)
All March 2022 release articles

November 2022
Top picks
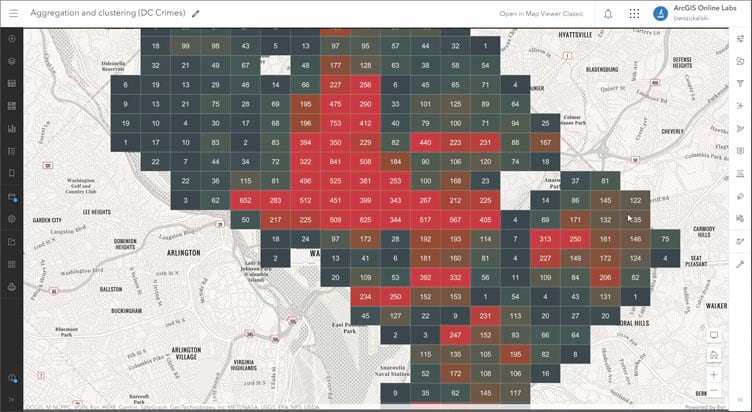
Map Viewer includes new options for summarizing point feature data. The Aggregation button now lets you configure geohash binning to aggregate point features into summary polygons. Bin size, fields, labels, and pop-ups can also be configured.

New clustering options are also available, including the ability to override the cluster symbol to differentiate between clustered and unclustered features. A new Clustering (Chart) style enables the the configuration of pie chart clusters that show the proportions of categories in each cluster using pie or donut symbols.
An enhanced ArcGIS Arcade expression editor is introduced with this update, and is available when configuring styling, pop-ups, and other layer visualization properties in Map Viewer. The improved editor features a dynamic expression writing experience with code completion suggestions based on your data.
Related records can now be shown in pop-ups, supporting one-to-one and one-to-many relationships.
Scene Viewer introduces the Dimensions tool to capture information about the dimensions of objects in a scene. Dimensions are saved as layers in the scene and can be captured in slides.
Other highlights
Symbol styler updates deliver more control over hatch patterns. Previews in the symbol styler now match what you see in the map. Color, rotation, and separation can be adjusted for each pattern.
Layers can be directly added in Map Viewer by importing data you have stored in supported file formats such as CSV, Excel, Service definitions, file geodatabase, GeoJSON, shapefile, KML, OGC GeoPackage, and Google Sheet layers.
Imagery layer support was also enhanced. Multidimensional imagery layers can contain many slices of data. You can now configure settings for multidimensional imagery layers to visualize a particular slice within a multidimensional imagery layer and specify which slices are displayed in the map.
Heat map style improvements were added, allowing you to soften the edges of heat map to focus on the hot spots and removing the prominences of outlier data.
ArcGIS Dashboards adds several new capabilities. You can now enable a search field in list elements to allow viewers to quickly find list items. You can also include a reset button on your dashboard to clear all selections and return any maps to their default extent.
New data management tools are added to the table view on the Data tab of the item page for hosted feature or table layers. Data updated represents when the layer’s content was last edited. When you open the Fields view on the Data tab, the Schema updated represents when the layer’s schema was last edited.
Item reports now include information about when an item was last viewed. Administrators can use the Item Last Viewed field to help identify old or unused items that should be considered for deletion or deprecation.
All the details
What’s new in ArcGIS Online (November 2022)
All November 2022 release articles

More information
For more information, and to stay on top of announcements and forthcoming releases, see the following:
The year ahead
There are many new capabilities and incremental improvements that will be introduced throughout 2023. You can contribute your ideas and help prioritize what’s delivered by providing feedback via ArcGIS Ideas.


Commenting is not enabled for this article.