ArcGIS Online lets you understand the world around you by using interactive maps to connect people, locations, and data. You get smart, data-driven styles and intuitive analysis tools that deliver location intelligence. ArcGIS Online gives you the ability to make maps and apps to share your insights with your organization or the world. You can use it as a complete, cloud-based solution or to extend and complement the capabilities of ArcGIS Pro and ArcGIS Enterprise.
Don’t have an ArcGIS account? See Create an ArcGIS Account.
The November 2022 update includes new functionality in Map Viewer plus other enhancements and new capabilities throughout the ArcGIS Online website. Highlights are provided below.
ArcGIS Online is updated three to four times each year. See the ArcGIS blogs to learn more about previous updates to ArcGIS Online and new functionality and enhancements you may have overlooked.
Don’t have time to read the blog article? View the video below instead.
Quick links
Use the links below to jump to sections of interest.
- Map Viewer
- Scene Viewer
- ArcGIS Instant Apps
- ArcGIS Dashboards
- ArcGIS Experience Builder
- Data management
- ArcGIS Notebooks
- Accounts and administration
- Content

Map Viewer
Map Viewer is the premier way to author, explore, and edit web maps. Administrators and members are encouraged to configure Map Viewer as their primary map viewer to take advantage of the new capabilities and enhancements that are delivered with each update.
Note: New features and capabilities, based on the latest JavaScript 4.x API foundation, found in Map Viewer, such as effects, blending, group layers, new styles, and more, are only supported in other JavaScript API 4.x apps. These include ArcGIS Instant Apps, ArcGIS Expression Builder, ArcGIS Dashboards, and ArcGIS StoryMaps. Older configurable apps and app builders do not support these newer features and capabilities.
With this update, Map Viewer has been enhanced with new capabilities and features, including the following:
ArcGIS Arcade expression editor
ArcGIS Arcade is an expression language that is supported across ArcGIS. It can be used to perform calculations, manipulate text, and evaluate logical statements. Arcade exists within a profile, or context, that defines the parameters that are available to the script as global inputs and the output expected from the script.
An enhanced ArcGIS Arcade expression editor is introduced with this update, and is available when configuring styling, pop-ups, and other layer visualization properties in Map Viewer. The improved editor features a dynamic expression writing experience with code completion suggestions based on your data.
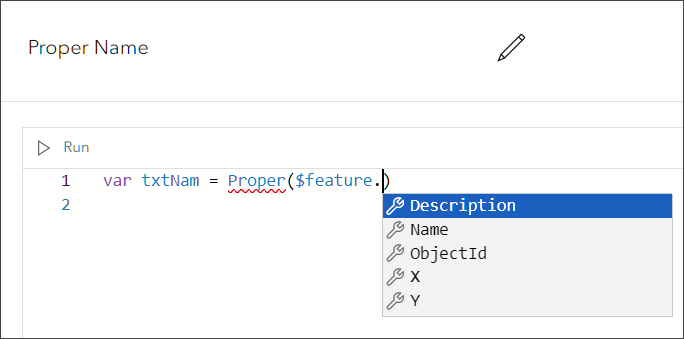
The editor also includes a function and profile search, and flags for unassigned variables and coding errors.
Aggregation and clustering
Map Viewer includes new options for summarizing point feature data. The Aggregation button now lets you configure geohash binning to aggregate point features into summary polygons. Bin size, fields, labels, and pop-ups can also be configured.
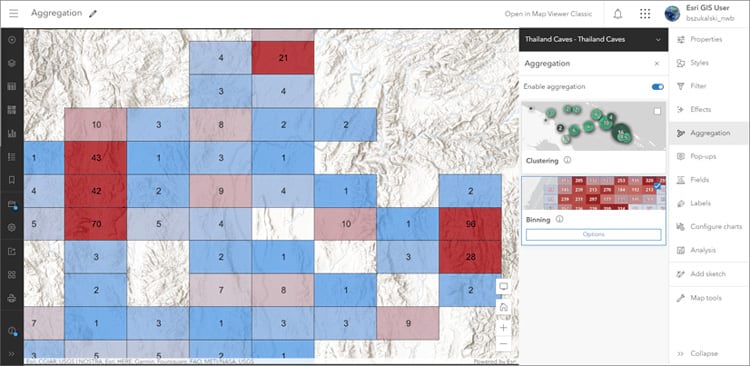
New clustering options are also available, including the ability to override the cluster symbol to differentiate between clustered and unclustered features. A new Clustering (Chart) style enables the the configuration of pie chart clusters that show the proportions of categories in each cluster using pie or donut symbols.
Aggregation summary statistics (mean, min, max, mode) are now automatically calculated for bins and clusters.
Clustering is also now supported in additional projections as alternatives to Web Mercator and WGS 1984.
Symbol styler updates
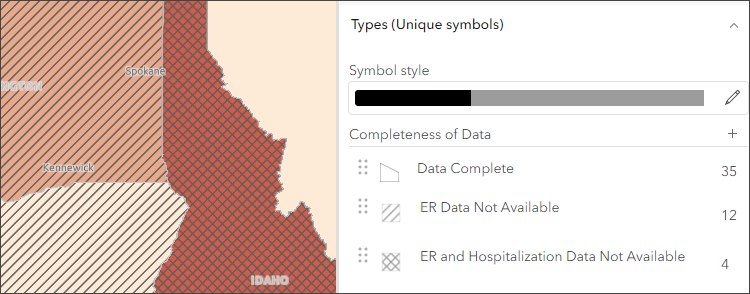
Hatch symbols were introduced in the June update, and with this update additional settings are now available to adjust the hatch pattern. Previews in the symbol styler now match what you see in the map. Color, rotation, and separation can be adjusted for each pattern.
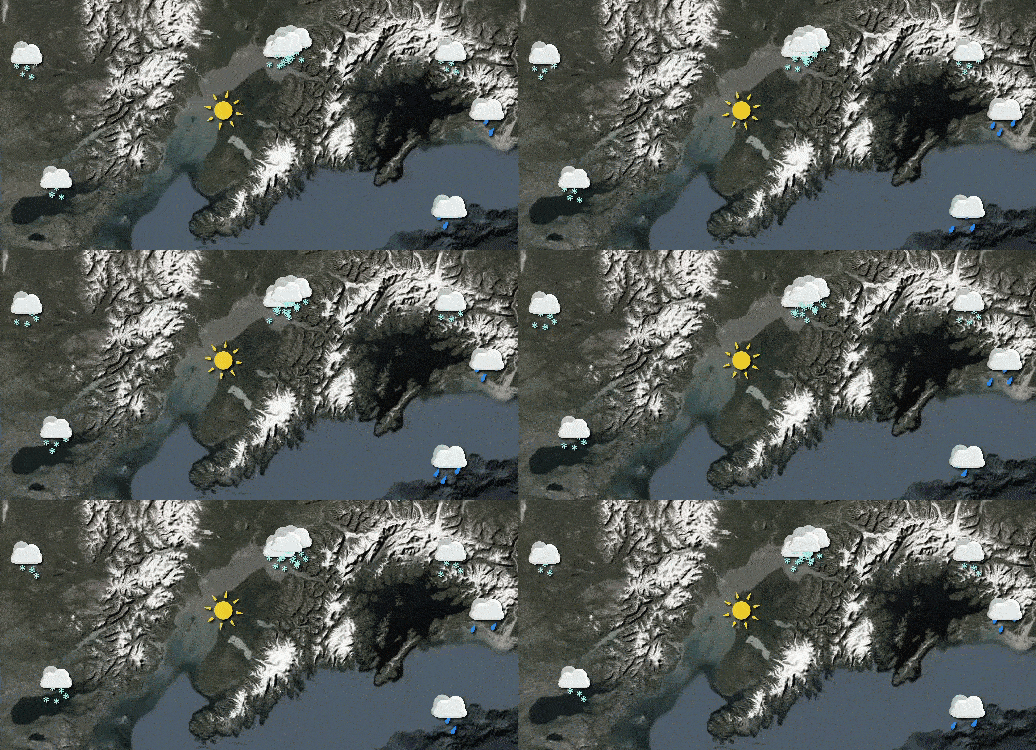
Settings for point and line animated symbols (published via ArcGIS Pro) have been enhanced to deliver more control over the animation settings. You can toggle animations on or off, change symbol size, reverse the animation direction, and control speed, looping, and duration.
Imagery layers
In Map Viewer you can modify the display of your imagery in your web maps. Multidimensional imagery layers can contain many slices of data. You can now configure settings for multidimensional imagery layers to visualize a particular slice within a multidimensional imagery layer and specify which slices are displayed in the map.
Related records in pop-ups
Some layers you add to Map Viewer may contain preestablished relationships to other tables or layers through a common field. For example, a layer showing buildings may have a preestablished relationship to a table with information about each building’s tenants. You can create data relationships within geodatabases in ArcGIS Pro and publish the data to ArcGIS Online or ArcGIS Server. Some of the analysis tools, such as Summarize Within, create relationships for you if you choose a field to group statistics.
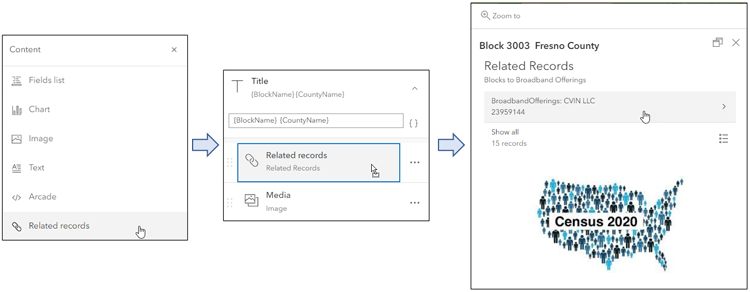
You cannot create relationships in Map Viewer, however if your layers have relationships, you can now show related records in pop-ups. Map Viewer supports one-to-one and one-to-many relationships.
To show related records, from the pop-ups pane click Add content, then choose Related records. The related records appear along with other content blocks you may configure. The example below shows a Related records block with a 1-M relationship along with an Image block.
For more information, see Rolling out related records in Map Viewer.
Heat Map style improvements
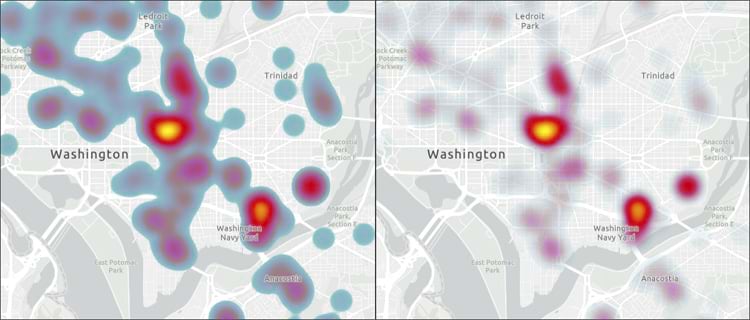
You can use heat maps when mapping the location of point features. Heat maps are useful when many of the points on the map are close together or overlapping, making it difficult to distinguish between features. They are effective for displaying layers that contain a large number of points.
A new slider in Map Viewer allows you to soften the edges of a heat map, providing additional cartographic control of your map’s appearance by focusing on the hot spots and removing the prominence of outlier data.
Directly add layers in Map Viewer
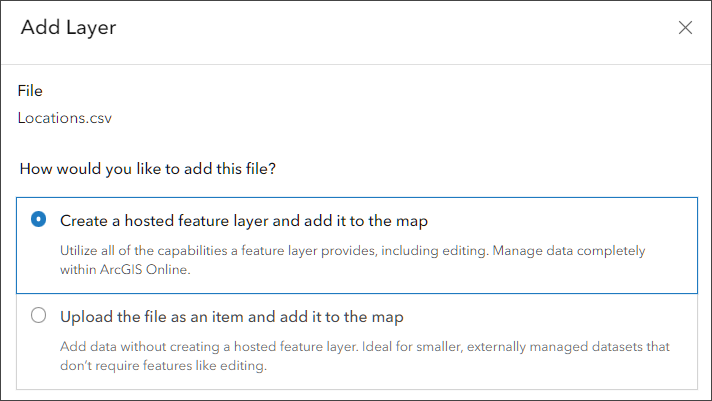
You can now directly add layers to Map Viewer by importing data you have stored in supported file formats such as CSV, Excel, Service definitions, file geodatabase, GeoJSON, shapefile, KML, OGC GeoPackage, and Google Sheet layers.
Optionally, when adding CSV or GeoJSON from local files, you can upload the file as an item and add it to the map without creating a hosted feature layer.
For more information, see Add layers from files.
Other improvements and enhancements
When styling your map layer to show categorical data, you can now manually add categories for values that do not yet exist in the data.
When configuring charts in Map Viewer, you can apply filters to show only the selected features or only the features in the current map extent.

Scene Viewer
Use Scene Viewer in ArcGIS Online for creating, viewing, and exploring 3D scenes. With this update, Scene Viewer has been enhanced with new capabilities and features, including the following:
Add dimensions
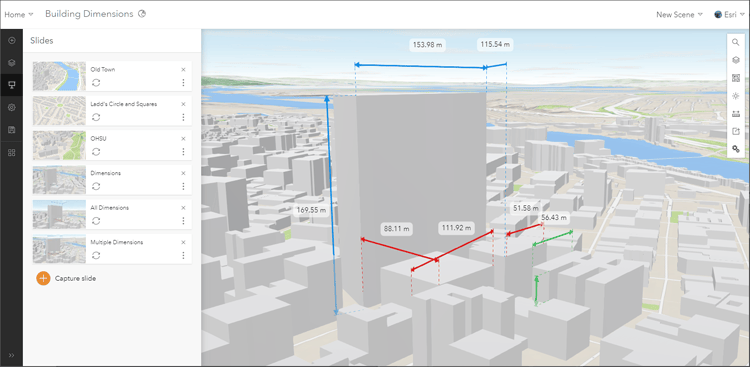
You can use the Dimensions tool to capture information about the dimensions of objects in a scene. Each dimensions layer allows you to create multiple dimensions with labels which display either the horizontal, vertical, or diagonal distance between the points.
You can group the dimensions into themes, with different colors and sizes for the lines and labels for each layer, which allows you to customize the visualization. The dimensions are saved in the scene and can be used in slides to share with stakeholders, such as for existing and proposed developments. Dimensions can also be captured in slides.
In addition, you can now use your keyboard <TAB> key to browse through all the UI elements in Scene Viewer.

ArcGIS Instant Apps
ArcGIS Instant Apps is the latest generation of configurable apps, featuring a streamlined experience that lets you build apps quickly and easily using express setup mode, or you can switch to full setup mode to select additional tools and settings. All Instant Apps templates can found on the searchable home page that can be opened in several ways:
- From the Overview tab for a map or scene item, click Create Web App and choose Instant Apps.
- From Content, click Create app then choose Instant Apps.
- From the app launcher.
- Using Map Viewer, click Create app in the Contents (dark) toolbar, then choose Instant Apps.
- Using Scene Viewer, click Create app in the Designer toolbar, then choose Instant Apps.
Hover over the badges in the app cards to learn more about new, updated, or beta apps.
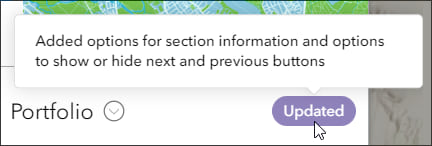
ArcGIS Instant Apps includes overall updates plus specific app updates.
Overall updates and enhancements
Create new apps and manage your existing ones in the My Apps tab. App cards have a redesigned look and feel, with options displayed directly on the card.
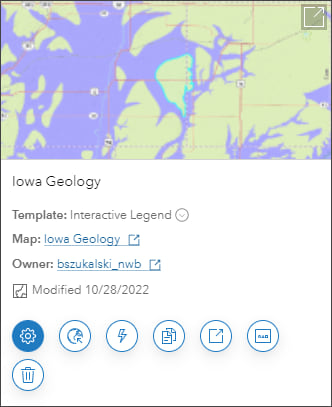
My Apps also adds filtering, so you can search apps using owner, app template, and sharing status.
The app template onboarding has been enhanced, making it easier to learn about app features and capabilities. When configuring an app, click Get started from the Action bar, then choose a setting or tool for more information and to be taken to the setting.
Updates for Instant Apps templates
Exhibit enables you to create a linear, interactive story using author-defined slides. Exhibit now has streamlined options for creating and editing multiple slides without leaving the slide configuration window.
Portfolio presents a series of maps, scenes, apps and other content (such as images). The template has been updated with new options for section information, and options to show or hide next and previous buttons.
Slider is used to display historical, live, or future data using any time interval. Updates include the ability to animate multiple layers with the numeric slider, and new options that enable you to simplify the look of the time slider by removing ticks and labels.
Chart Viewer lets you display bar charts, line charts, pie charts, histograms, and scatter plots to complement your map. It now has a new selection tool allowing for map selections to be represented in the chart.
3D Viewer showcases your scene with 3D navigation tools, including zoom controls, pan, rotate, and compass. 3D Viewer is updated with added options to configure time-enabled data and the ability to add a cover page
When you include a layer list with the option to show the attribute table in Sidebar, Media Map, and 3D Viewer, users can now export records as a CSV file.
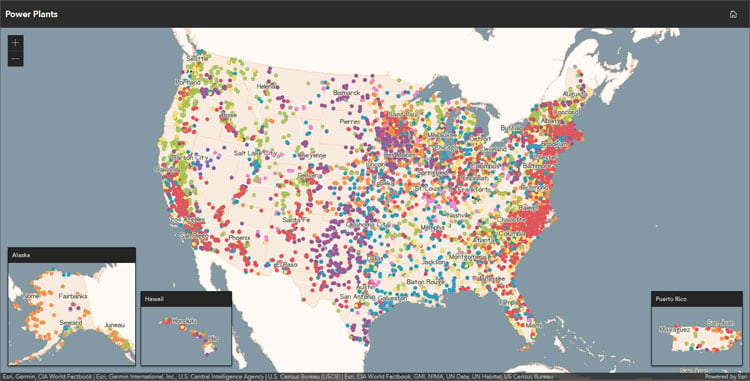
Insets is introduced in beta. The app template is intended to enable the display of noncontiguous geographic locations within a single app layout. You can choose from a list of predefined geographic layouts, or customize the inset locations using bookmarks from the map.
For more information, see What’s new in Instant Apps.

ArcGIS Dashboards
ArcGIS Dashboards enables users to convey information by presenting location-based analytics using intuitive and interactive data visualizations. Dashboards are used to help make decisions, visualize trends, monitor status in real time, and inform their communities.
With this update, ArcGIS Dashboards includes several new capabilities. You can now enable a search field in list elements to allow viewers to quickly find list items. You can also include a reset button on your dashboard to clear all selections and return any maps to their default extent. Additionally, the new follow feature action allows viewers to select to pan and stay centered on a feature on a map.
ArcGIS Dashboards Classic has been retired and is no longer available. All dashboards now open in ArcGIS Dashboards.
For more information, see What’s new in ArcGIS Dashboards.

ArcGIS Experience Builder
Use ArcGIS Experience Builder to build modern mapcentric or non-mapcentric web apps and webpages without writing any code. Engage your audience through compelling web experiences on any screen size. Start from scratch or choose from an extensive library of templates that you can easily customize. Add advanced functionality with widgets you can drag, drop, and configure. Enjoy fully flexible layout options to build any web experience for any purpose.
Two new widgets are available in ArcGIS Experience Builder. The Coordinates widget displays longitude, latitude, elevation, and camera altitude values when available. The Grid widget is a layout container you can use to organize content in a grid. Other enhancements include support for setting links to email addresses, phone numbers, and more.
For more information, see What’s new in Experience Builder.

Data management
You can now upload .gif image files to share with others or use in pop-ups.
When you open the table view on the Data tab of the item page for a hosted feature layer or hosted table layer, the date and time displayed for Data updated represents when the layer’s content was last edited. When you open the Fields view on the Data tab, the Schema updated represents when the layer’s schema was last edited.

When using ArcGIS Arcade to build calculated expressions in forms, you can now use a FeatureSet to create expressions that interact with features in other layers. For example, you can apply an expression to a ZIP code field that extracts a ZIP code value from an intersecting parcel layer.

ArcGIS Notebooks
You can now create your own code snippets in ArcGIS Notebooks. Code snippets are reusable, prewritten code that you can insert to implement common workflows across notebooks. Code snippets are organized in code snippet libraries, which you can share with others.

Accounts and administration
Organize members using categories
ArcGIS Online organizations can set up hierarchical categories for organizing members according to characteristics such as department, location, and expertise. Administrators can use these member categories to filter the list of members when performing member management tasks.
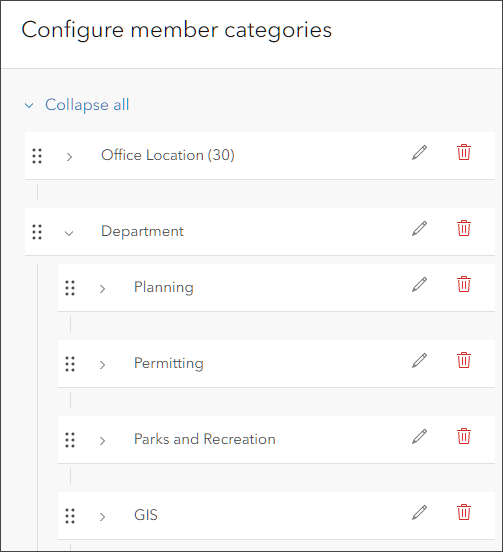
With this update, administrators can now specify a default set of member categories to automatically assign to new members when they join the organization. Member categories make it easier to find and manage members. For more information, see Learn more about member categories.
Inviting new members
When inviting members in bulk to your organization using a CSV file, the process of identifying and fixing field errors has been improved. Errors are now clearly flagged and can be fixed directly in ArcGIS Online without requiring you to upload a new or modified file.
Managing custom basemap galleries
A new experience is available for managing your organization’s custom basemap gallery. Administrators can easily identify and remove deprecated basemaps, and check for new Esri default basemaps to add to the gallery.
Item reports
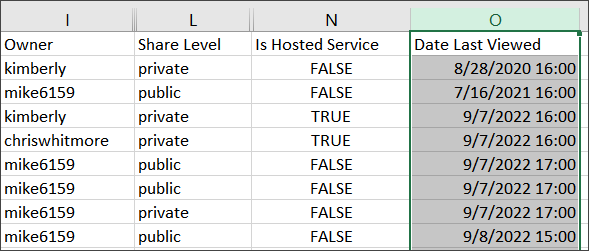
Item reports now include information about when an item was last viewed. Administrators can use the Item Last Viewed field to help them manage content in the organization—for example, to identify old or unused items that should be considered for deletion or deprecation.
Organization Home page
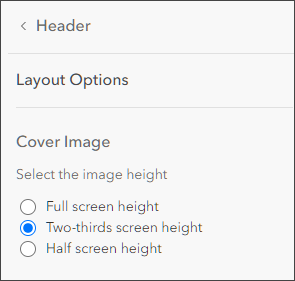
A new formatting option is available when configuring the header of your organization home page. You can now set the height of the cover image to two-thirds of the screen, as an alternative to the full screen or half of the screen.

Content
ArcGIS Living Atlas of the World is the foremost collection of geographic information from around the globe. It includes curated maps, apps, data layers, and tools from the global GIS user community and Esri that support your work.
All Esri vector basemaps are updated at regular 3-week intervals. OpenStreetMap (OSM) basemaps, including 3D basemaps, are updated monthly using the OSM Daylight Distribution.
Elevation layers are updated roughly every quarter. For more information, see elevation update blog articles.
World Imagery is updated monthly and now includes expanded detailed updates from Maxar. This new data updates more than 50M square kilometers of existing regional coverage from 1.2m resolution to 60cm resolution. For more information, see What’s New in World Imagery September 2022.
Imagery and vector basemaps also include updates from contributions via the Community Maps Program.
For more information about ArcGIS Living Atlas, visit the ArcGIS Living Atlas website, view Living Atlas blog articles, or browse for content of interest.

More information
For more information and additional details about this release, see the What’s new help topic or view all posts related to this release. You can also watch a video demo to see the new capabilities in action.
For other information, see the ArcGIS Online blog articles and ArcGIS Online at the Esri Community.
For news, updates, and information about other products, see the ArcGIS Blog and product resources at the Esri Community.


Commenting is not enabled for this article.