In Part 1 of this series, we introduced FeatureSets as a way to work with other layers within your map to make more expressive pop-ups by writing just a few lines of code. In Part 2, we’ll look at performance and how to access features in the FeatureSet.
Before we go further, I think the single most important piece of advice with Arcade is to be purposeful when writing Arcade expressions. Sketch out the goal on a pad of paper first before you start writing and think about the problem you want to solve before you dive in.
Understanding what’s slowing you down
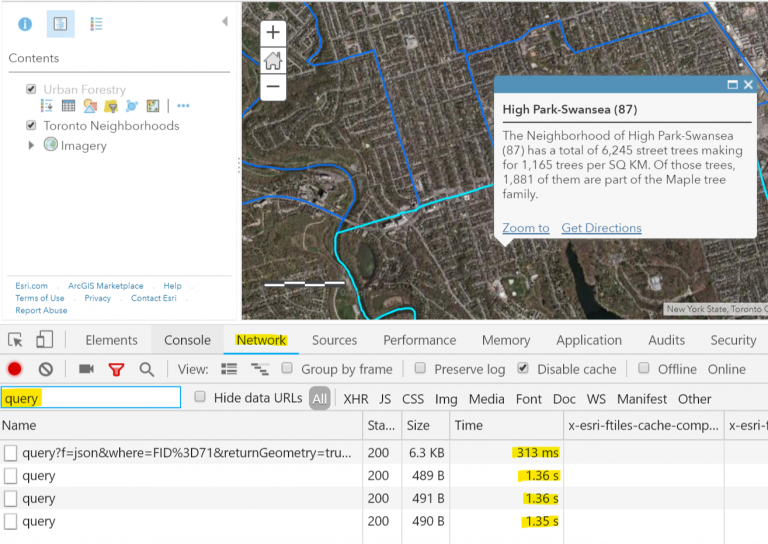
If your expression is slow (e.g. the pop-up is too slow), the fastest way to investigate the performance is to use the Network tab of the Chrome browser debugger (Ctrl+Shift+J) to filter the requests by the word query. Then click a feature on the map, watch the queries being executed and find the bottleneck by looking at the time column. Once you have an idea which query is slowing you down, you can start to understand how you might be able to optimize the expression.
Chaining, number of queries, and performance
Arcade needs to query the data in the feature layer in order to evaluate expressions. Because of that, it stands to reason that the more times an Arcade expression queries the feature layer, the slower the pop-up loads. This is true whether you write one expression that queries the layer multiple times, or write multiple expressions that each query the data. If you recall the map from Part 1, you’ll notice that from time to time the pop-up can take a bit longer than you’d like to load. There are 3 expressions in the pop-up:
- One to get the total trees in the neighborhood
- One to get the total trees and then calculate the density
- And one to get all the maple trees in the neighborhood
The first 2 expressions are using an identical FeatureSet and therefore the same query. In order to load the pop-up, the expression executes 2 identical queries, plus a 3rd unique query. In the following example from Part 1, we could adjust the pop-up to use a single Arcade expression and improve the performance by reducing the number of queries to the trees layer from 3 to 2.
// Get all the trees and count them

var trees = FeatureSetByName($map,"Urban Forestry")

var countTrees = Count(Intersects(trees,$feature))
// Calculate the tree density

var treeDensity = Round(countTrees / AreaGeodetic($feature, 'square-kilometers'),2)
// Get all the maple trees and count them

var mapleTrees = Filter(trees,"COMMON_NAM LIKE '%MAPLE%'")

var countMapleTrees = Count(Intersects(mapleTrees,$feature))
// Build the pop-up string

var finalString = "The Neighborhood of " + $feature["AREA_NAME"] + " has a total of "+ countTrees + " street trees making for " + treeDensity + " trees per SQ KM. Of those trees, " + countMapleTrees + " of them are part of the Maple tree family."

return finalString
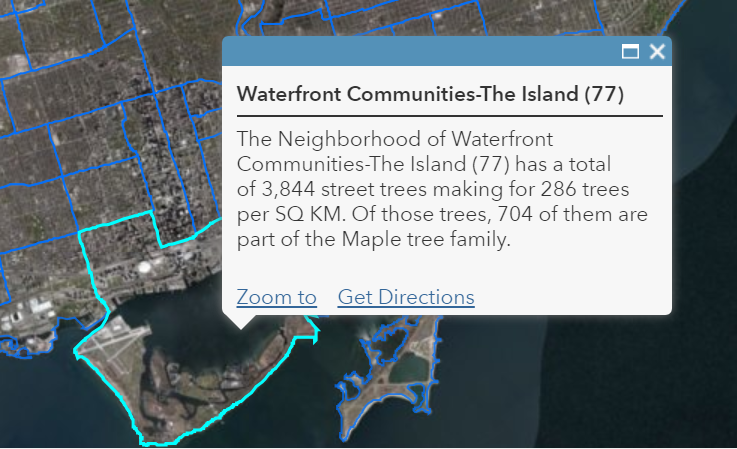
The result will be identical but what we’ve done (as shown below) is combine all 3 previous expressions into 1, which gives us the opportunity to reuse FeatureSetByName($map,"Urban Forestry") to get the count and then not have to query it again to calculate the density. The 2nd query is still sent to get the number of Maple trees. While the performance savings may not always be obvious depending on the complexity of the data, it is always a good practice to think about how many queries are getting sent to the feature layer to ensure performant expressions.
Chaining happens when the script executes. Functions that can be chained are aggregated as a single query, which is then sent to the feature layer. The FeatureSet is lazy, meaning it doesn’t evaluate until it is used in another function, or iterated through in a loop. That is why just defining FeatureSetByName($map,"Urban Forestry") doesn’t query the service in the example above. Once it is used in this function chain Count(Intersects(trees,$feature)) the query is made with the parameters determined by the functions.
Because of that lazy execution and chaining, the following two expressions are identical, and will have the same performance with respect to query execution:
var trees = FeatureSetByName($map,"Urban Forestry")

var treesInt = Intersects(trees,$feature)

var treesCount = Count(treesInt)

return treesCount
VS
var treesCount = Count(Intersects(FeatureSetByName($map,"Urban Forestry"),$feature))

return treesCount
Reduce, sort, and summarize
Up until now, the examples we’ve used have only involved getting the number of features in a FeatureSet and then doing something with it. You can also dig into a FeatureSet by looping through it and exploring individual features. Before we look at that, though, I want to talk about the importance of reducing the number of FeatureSets before you start iterating over them. Reduction is essential especially with larger datasets. Trying to query and work with millions of features will not be fast enough to be useful. There are over 500,000 trees in the layer above and if I wanted to iterate over all the trees just to show a value in the pop-up, we would be waiting for a very long time. You need to leverage the functions available to you to reduce the features you’re working with down to a manageable size. That can be done in a variety of ways:
- Filter the layer in your map before you start writing your expression or use the filter. Attribute-based filtering is almost always faster than spatial filtering and you should use it first if possible. If you are looking to refer to a variable inside of your filter expression, you can reference inside the filter function by putting an @ in front of the variable.
var filterValue = '%MAPLE%'

var mapleTrees = Filter(trees,"COMMON_NAM LIKE @filterValue ")

var countMapleTrees = Count(Intersects(mapleTrees,$feature))
- Use Geometry operations like Intersects, Overlaps, etc. to minimize the features that you’re working with.
- Pair together Sorting (Orderby) and Limiting (Top) the results to get what you want. For example:
var trees = FeatureSetByName($map,"Urban Forestry")

var diamTrees = Top(OrderBy(Intersects(trees,$feature), 'DBH_TRUNK DESC'),5)
This will give you a FeatureSet that only contains the top 5 trees with the largest trunk size sorted by size in the neighborhood.
- Let the feature layer calculate the stats for you instead of doing it yourself.
var trees = FeatureSetByName($map,"Urban Forestry")

return Max(Intersects(trees,$feature), 'DBH_TRUNK')
This returns the tree in the neighborhood with the largest trunk size.
Now that we have that out of the way, let’s do something useful with the features inside the FeatureSet.
Working with data inside FeatureSets
Continuing with the example above, let’s look at the 5 trees with the largest diameter in each neighborhood, and add some information into the pop-up like the tree name and the tree’s diameter. To start, we’ll use our previous code and add a for loop to iterate over the 5 trees in the FeatureSet.
var trees = FeatureSetByName($map,"Urban Forestry")

var diamTrees = Top(OrderBy(Intersects(trees,$feature), 'DBH_TRUNK DESC'),5)

var popupResult = ''

for (var f in diamTrees) {

popupResult += f.COMMON_NAM + "(" + f.DBH_TRUNK + "cm)" + TextFormatting.NewLine

}

return Proper(popupResult)
If you add the expression above to the Neighborhood layer, and then put that in a custom pop-up with a nice header (“Top 5 Largest Trees”), it might look something like this. The red box below shows the Arcade expression portion.
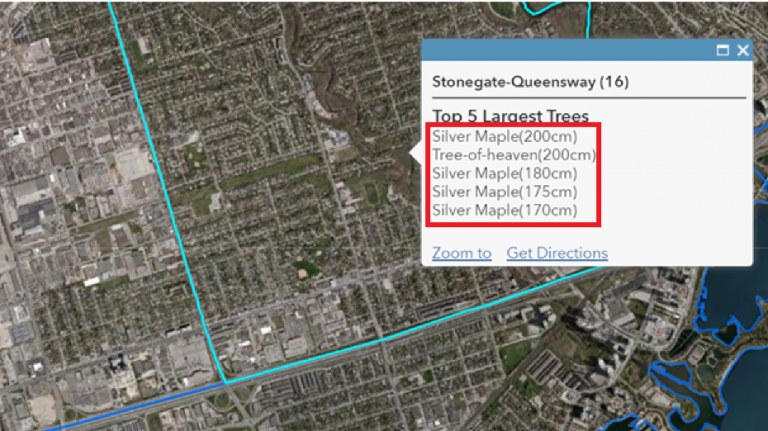
So, what is happening in the example above? We’ve introduced a for loop into the expression to iterate over the FeatureSet diamTrees. Inside that for loop, we’ve got a single statement:
popupResult += f.COMMON_NAM + "(" + f.DBH_TRUNK + "cm)" + TextFormatting.NewLine
This statement builds the text we see in the screenshot above. It does this by concatenating values from the feature together with some static text for formatting. You’ll notice the f.<fieldname> notation is used to access a specific field within the current feature (denoted by f) in the FeatureSet, and is also taking advantage of TextFormatting.NewLine to add a break between feature information in the pop-up. With each pass through the for loop, we append the new string to popupResult using the += assignment.
Key things to remember
I happen to like lists, so heres a list to help summarize what we’ve learned into a handy set of tips:
- Define the minimum needed FeatureSets required to do the job
- Always reduce your FeatureSets when you can
- Filtering by attributes will always be faster than filtering by geometry
- Chain functions together when possible to reduce queries
- Use stats and sorting to avoid unnecessary loops
- Review Part 1 of this blog series
Learn more
Keep an eye on our blog page for a closer look into using FeatureSets, specifically when calculating fields. Until then, if you want to read more about Arcade, be sure to check out the Developers Site, along with our Community Github site with great Arcade examples.

Commenting is not enabled for this article.