These activities are great for at-home learning and something any parent, guardian, or teacher can do with their child or student. Some activities can be done totally free! However, some of the best stuff in GIS requires an ArcGIS Online account. First, we recommend you check with your school to check if your child already has a school account so they can save and share their work when school returns. If your learner does not have an account, a parent or guardian can sign up for a free summer-long account at Learn ArcGIS website for access to all the tools you need to become a mappy family.
Also check out the other #TakeYourWorkToKidsDay Challenges here:
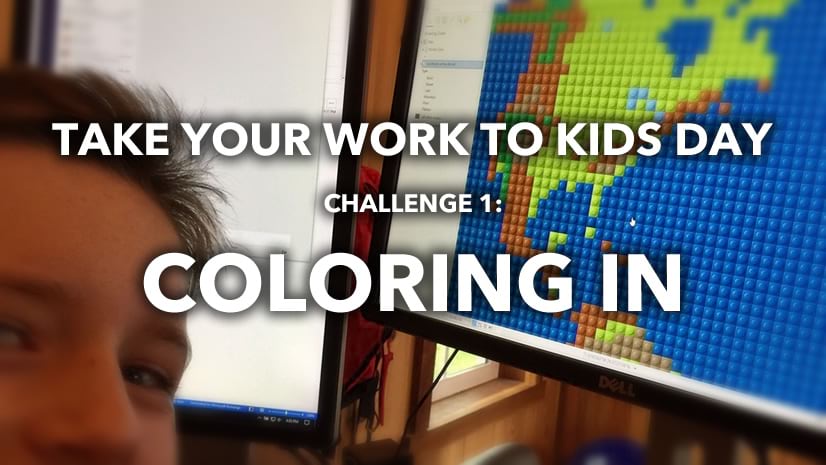
#1: Coloring In
#2: A Forest of Color
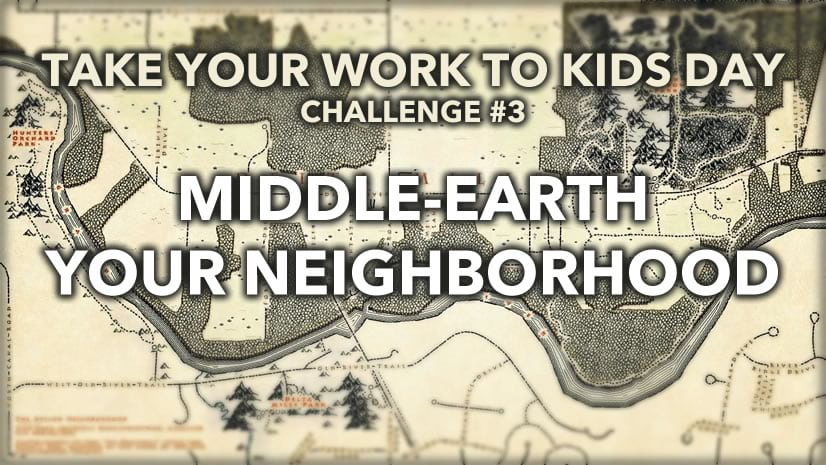
#3: Middle Earth Your Neighborhood
#4: Adventure Awaits
#5: Assemble!
Since many of us are all stuck at home, now is the perfect time to think about places we want to visit once we can safely travel. Maybe it’s a national park, the top of a skyscraper, an entire city, or a country you’ve always dreamed of seeing. Let’s create a map of all of these places. You can also modify challenge to map places you have already been.
I shave shared a map that you can start editing.
https://arcg.is/SObqr
Countries and States
Maybe you just want to create a map of states and countries you want to visit. Let’s start by creating outlines around those states in the U.S. To do that, we will apply a Filter that selects the states by their name.

- On the States layer, click the Filter symbol.
- Click the Edit tab.
- Click Add Another Expression.
- In the new layer, pull down the menu on the left and select Name.
- In the box on the right, type in the name of the state you want to visit. In this example, I put Florida. You can change the other states already listed from California and New York to something else, or delete them by clicking the red X.
- Click Apply Filter. Notice Florida is shown with an orange outline and label.
You can repeat the same steps with the Countries label. When creating the filter, you’ll want to select COUNTRY from the pull-down menu instead of Name like you did for the States layer.
Want to change the color of the outline? That’s easy.

Place a Pin on Locations
Maybe you want to visit a specific city or place, like the Statue of Liberty. We can place colored pins at those different locations. Let’s start by finding where those places are and then marking them then adding in additional information.

- At the top right in the Find and address or a place box, search for Statue of Liberty. The map will zoom into the location.
- At the top left, click Edit. Select the green Stickpin under Attractions. Now place that pin on the map where you want it to go.
- An information box will pop up. Follow the GIF below to add in the information, such as the title and description. If you find an image online, you can place that in the Image URL box.
- If you want to use a different type of symbol than the green Stickpin, select Change Symbol in the information box. You can choose from hundreds of different symbols and shapes.
- You can remove that pin or other pins on the map by clicking Delete.

Click back on the Details area at the top left of your map menu. If you click on the pin you just created, you’ll get a pop up with the information you just added.

Repeat this process for other attractions.
There is another layer for Cities, so you can use different colored pins for cities vs. attractions.
Once you are done, you have a new map. Be sure to save it and show your friends and family. Maybe they can make one too so you can compare? Or start tackling another #TakeYourWorkToKidsDay Challenge!


Article Discussion: