The ability to host and analyze imagery data is vital to the work of many organizations. To demonstrate these workflows in action, Vinay walks through an overview of ArcGIS Image for ArcGIS Online (coming this summer) to explore its hosted imagery capabilities along with visualization and advanced raster analytics in the cloud. If you’ve already used or are familiar with these workflows in ArcGIS Enterprise, you’ll know how excited we are to announce they’ll soon be available to ArcGIS Online as well.
In this analysis, Vinay studies the impact and severity of fire incidents across California last year where approximately 10,000 fire incidents burned 4.3 million acres across the state. He’s using a collection of ten satellite images that cover roughly 3,000 square miles of southern California near Santa Rosa. Up until now, he’s stored the images on his local machine. Using ArcGIS Image, he shows how to seamlessly host and analyze this imagery in ArcGIS Online.
Here are the steps he follows:
- From My Content, click Create
- Select Create Imagery Layer
- Choose an Image Collection and specify the raster type to describe the imagery
- Optionally specify additional properties and parameters such as processing templates
- Drag and drop the imagery files and corresponding metadata
- Provide a title, description, and tags
- Create the Imagery Layer
Once the imagery layer is in place, he’s ready to begin his analysis using a series of raster functions. He accesses the function editor where more than 150 raster functions are available. Raster functions can be chained together to create custom analytical workflows and shared across the organization.
Vinay uses a pre-created burn severity template to evaluate his hosted imagery. He sets parameters and runs the analysis. Once the tool runs, results are added to the map and show high burn severity areas in orange.
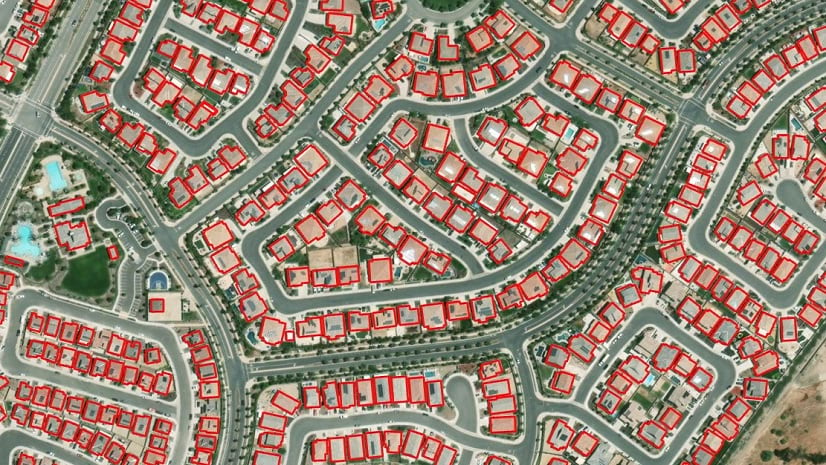
Next, he wants to determine how many structures are found in the high severity areas. As he doesn’t yet have building footprints already mapped for the area, Vinay leverages new deep learning capabilities to extract building footprints. From the Raster analysis tools pane, Vinay expands the Deep Learning section and selects the Detect Objects using Deep Learning tool.
In setting the parameters of the model, he first specifies for the tool to run against Airbus high-resolution imagery. Next, he selects a building footprints extraction model from ArcGIS Living Atlas of the World.
Once Vinay runs the model, his results are added to the map. The model was successfully able to extract the building footprints from the high-resolution imagery. After matching up the building footprints with the burn severity areas, he’s able to determine that 1,500 structures, shown in blue, are within the burn perimeter.
This was just one scenario for using ArcGIS Image to host large imagery and perform advanced raster analysis in ArcGIS Online. We’re excited to see what problems you tackle with this new capability!
Learn more:


Article Discussion: