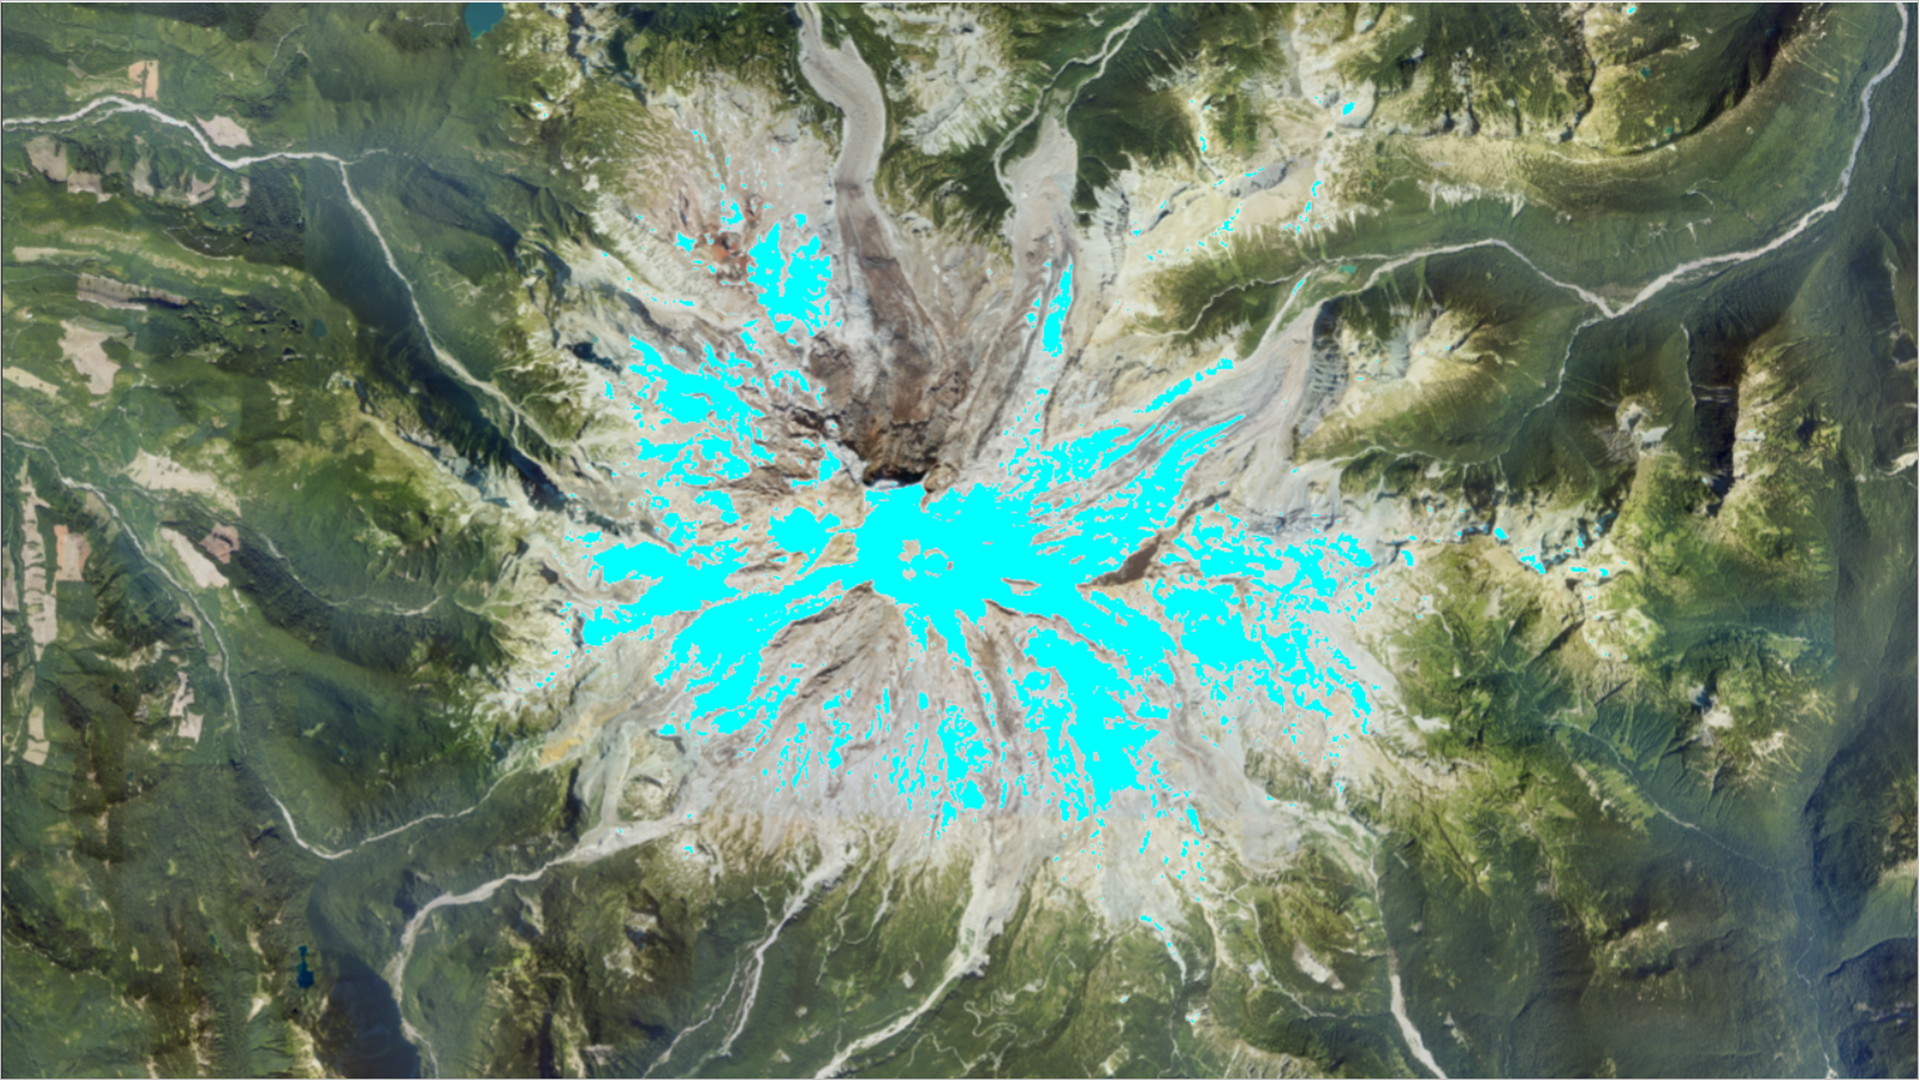
The ArcGIS Online imagery June 2026 update introduces powerful new capabilities for hyperspectral analysis, imagery visualization, and change detection—all within a fully managed SaaS environment.
Imagery in ArcGIS Online makes it easy to host, explore, analyze, and share imagery at scale-without standing up or maintaining your own infrastructure. From simple visualization to advanced analytics and deep learning, organizations can turn imagery into actionable insights using a secure, fully managed SaaS environment. Once imagery is organized and published, teams across the organization can use it in maps, apps, and analysis workflows to support faster, more informed decisions.
The June 2026 update builds on this foundation with additional hyperspectral analysis tools, web imagery charts, and the Image Change Detection widget for Experience Builder.
List of enhancements:
- Hyperspectral imagery support
- Three new hyperspectral imagery tools – Detect Target Using Spectra to identify pixels that match a spectral signature, Detect Image Anomalies to generate a anomaly score for multiband or hyperspectral images , and Resample Library Spectra to resample the bands of a spectral library to match a target library.
- New wavelength support in band arithmetic function and band selection with wavelength in a drop-down list.
- Map Viewer imagery enhancements
- New charting styles (histogram, scatter plot, and bar chart) for imagery layers.
- New Living Atlas layers with optimized raster analysis – Additional Living Atlas layers are now tuned for higher‑performance raster analysis.
- Other imagery enhancements
- Image Change detection widget for Experience Builder applications to use spectral angles to compare imagery.
- Item details assistant (beta)
- Oriented imagery enhancements
- New ways to add video to ArcGIS workflows with Oriented Imagery

Hyperspectral imagery support
There are new hyperspectral tools added for this release that will enhance your hyperspectral workflows in Map Viewer. These raster analysis tools allow you to further your research into mineral analysis with hyperspectral imagery data..
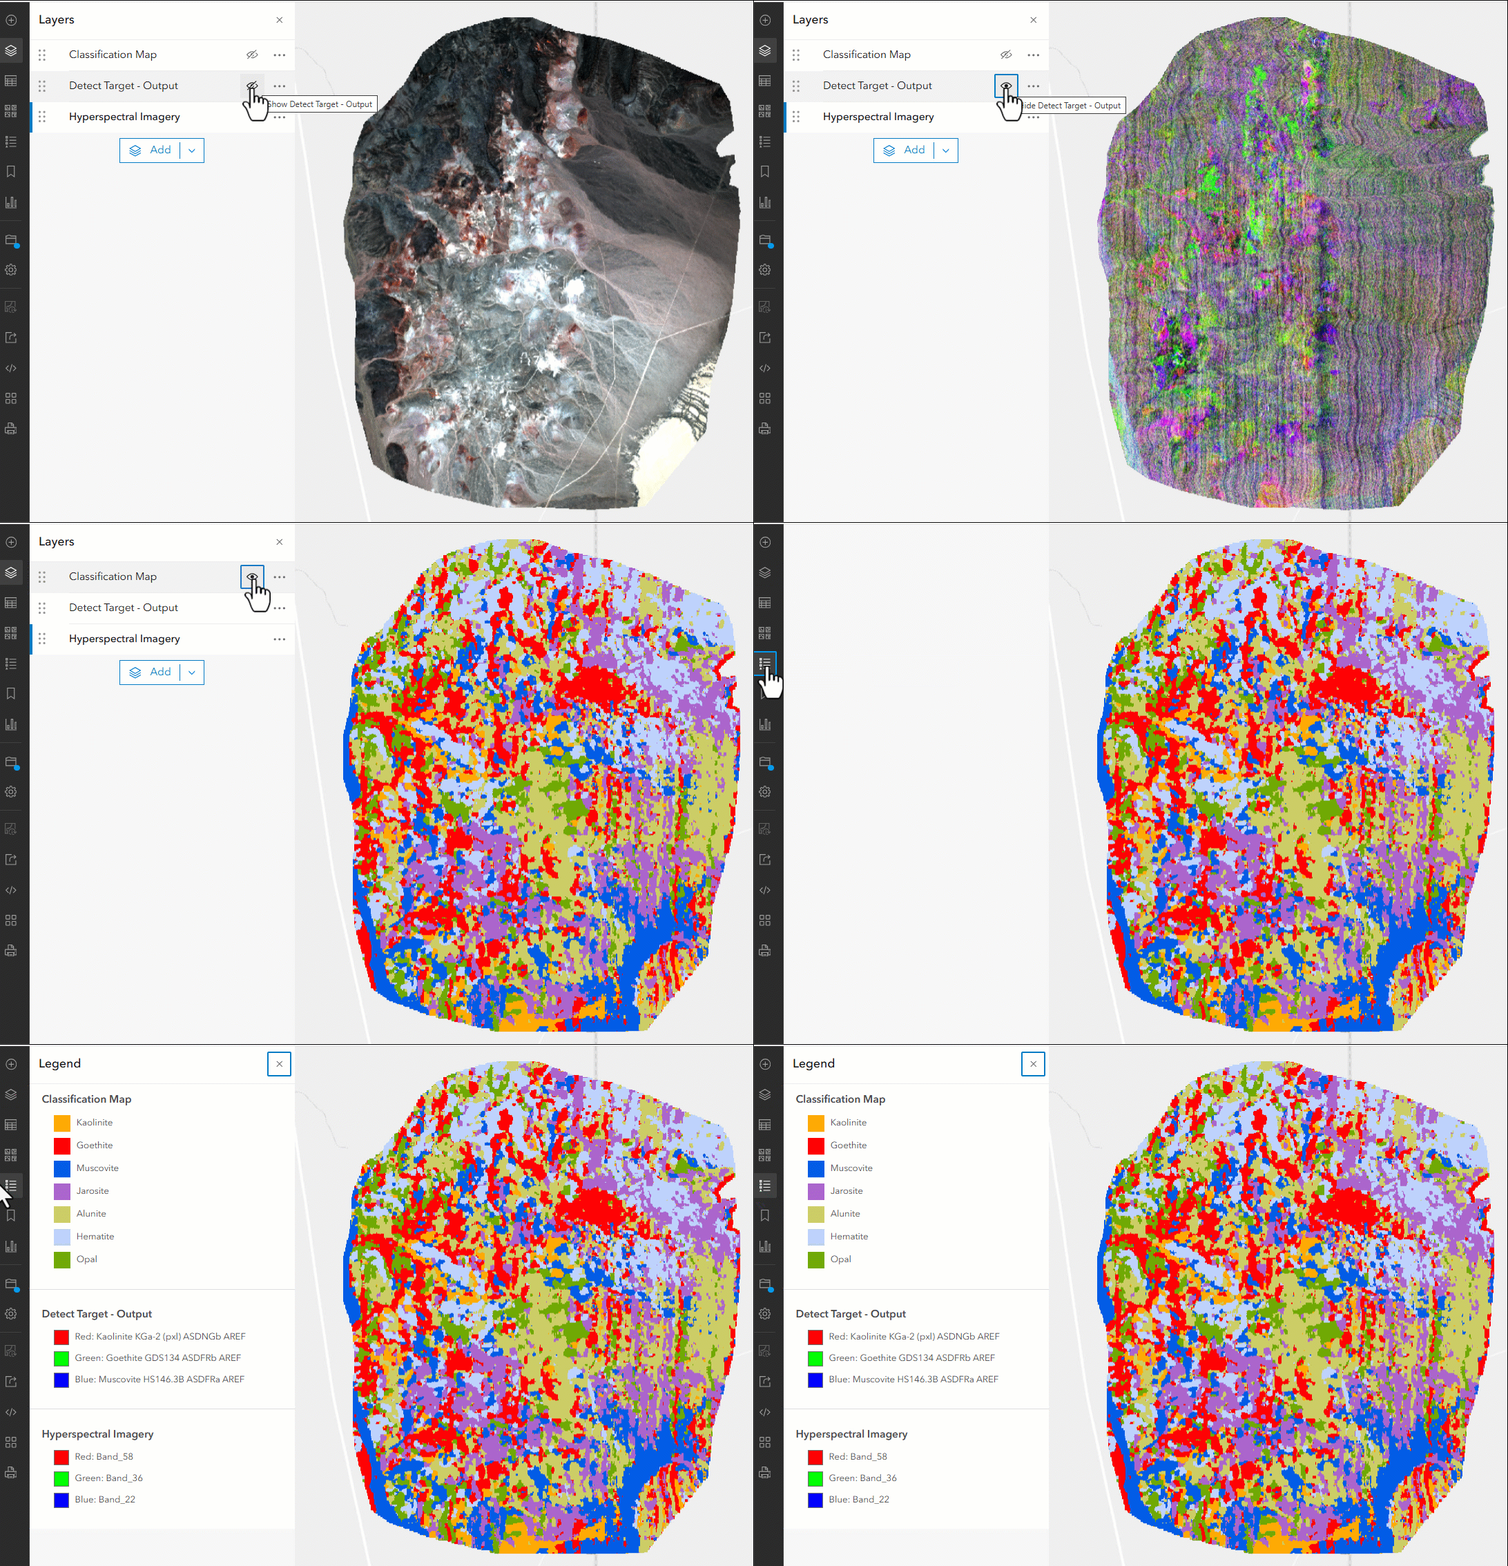
The Detect Target Using Spectra tool computes a matching score for each pixel in an input raster based on how well the pixel’s spectrum matches the target spectra defined by an input spectral signature file, producing a hosted imagery layer as the output.
The Detect Image Anomalies tool creates an anomaly score raster from an input multiband or hyperspectral image. The anomaly score raster is a single-band raster with values between zero and one.
The Resample Library Spectra tool resamples input library spectra to match the number of bands and wavelength range of target spectra from a target sensor, custom spectral library file, or custom image.
This GIF is showing Map Viewer with hyperspectral imagery and analysis output layers; the user toggles visibility to switch from the original image to output of Detect Target Using Spectra tool, and a postprocessing using Raster Function Template to generate a classification map and highlight detected target minerals.
Map Viewer imagery enhancements
New charting styles for imagery layers
This release introduces charts for imagery layers—a powerful way to visualize and explore raster data within your web map.
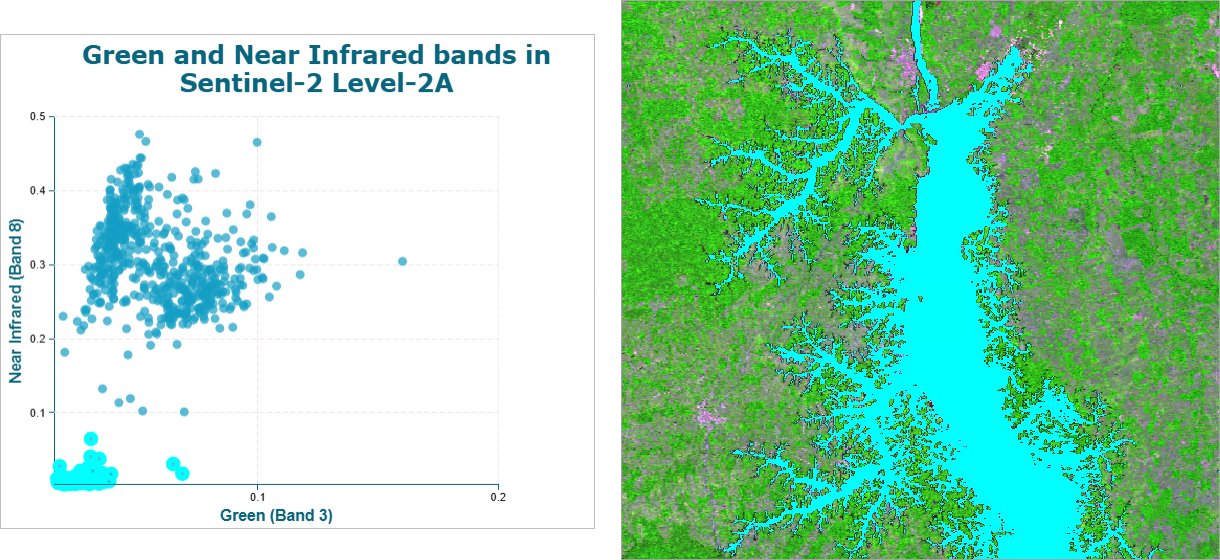
You now have the ability to create bar charts, histograms, and scatterplots for imagery layers in Map Viewer. You can create these charts using dynamic imagery layers, tiled imagery layers, and WCS layers.
Bar charts
Discover trends in categorical or thematic raster datasets.
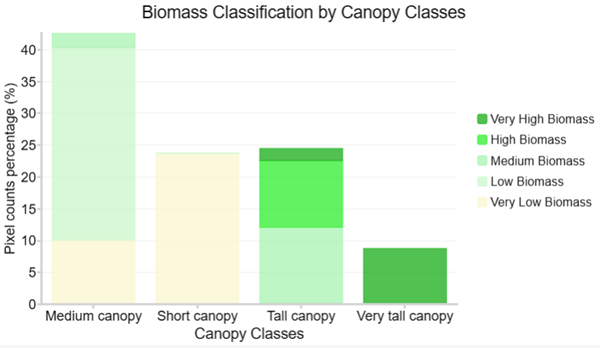
Bar charts can be created from imagery layers with a raster attribute table.
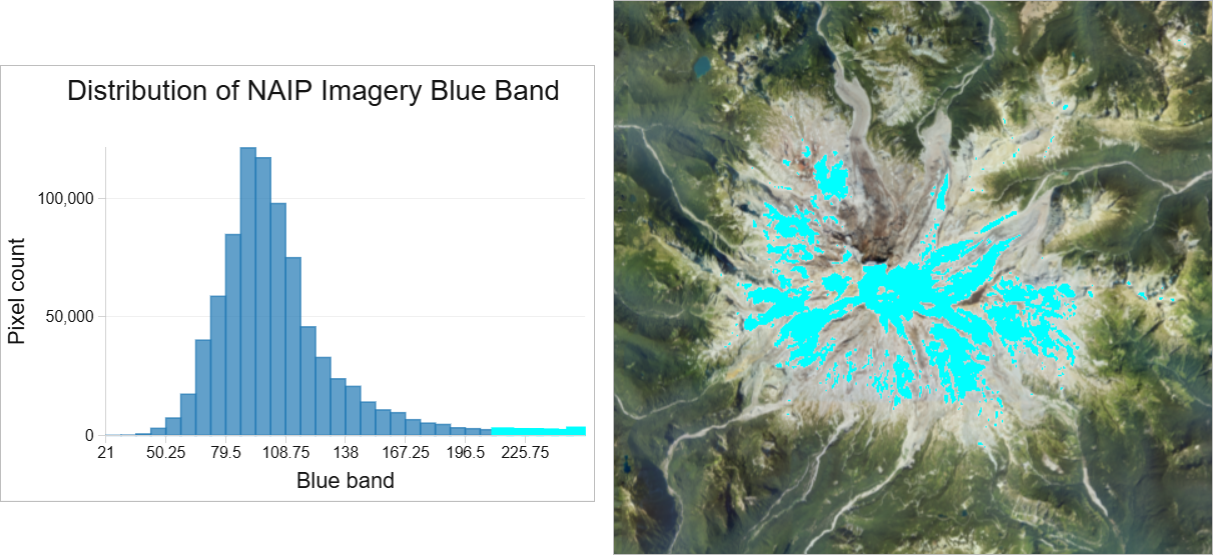
Histograms
Understand how pixels are distributed for a particular band in a multiband dataset.
Scatterplots
Observe the correlation between two spectral bands in multiband imagery.
New Living Atlas layers with optimized raster analysis
ArcGIS Living Atlas of the World has included a variety of global Earth observation imagery layers. These layers have empowered users across industries to perform powerful visualization and analysis directly within ArcGIS Online without the need to download large datasets. These imagery layers now include demographic thematic imagery layers and additional land cover thematic layers.
This optimization was introduced in a previous release on a select set of ArcGIS Living Atlas imagery layers, enabling support for significantly larger areas of analysis. This capability is currently available for imagery layers belonging to the Living Atlas Imagery Layers Optimized for Analysis group. For more information about the optimization and how to enable it, please refer to the blog, ArcGIS Living Atlas ready-to-use imagery layers for analysis.
Other imagery enhancements
Image Change Detection widget for Experience Builder
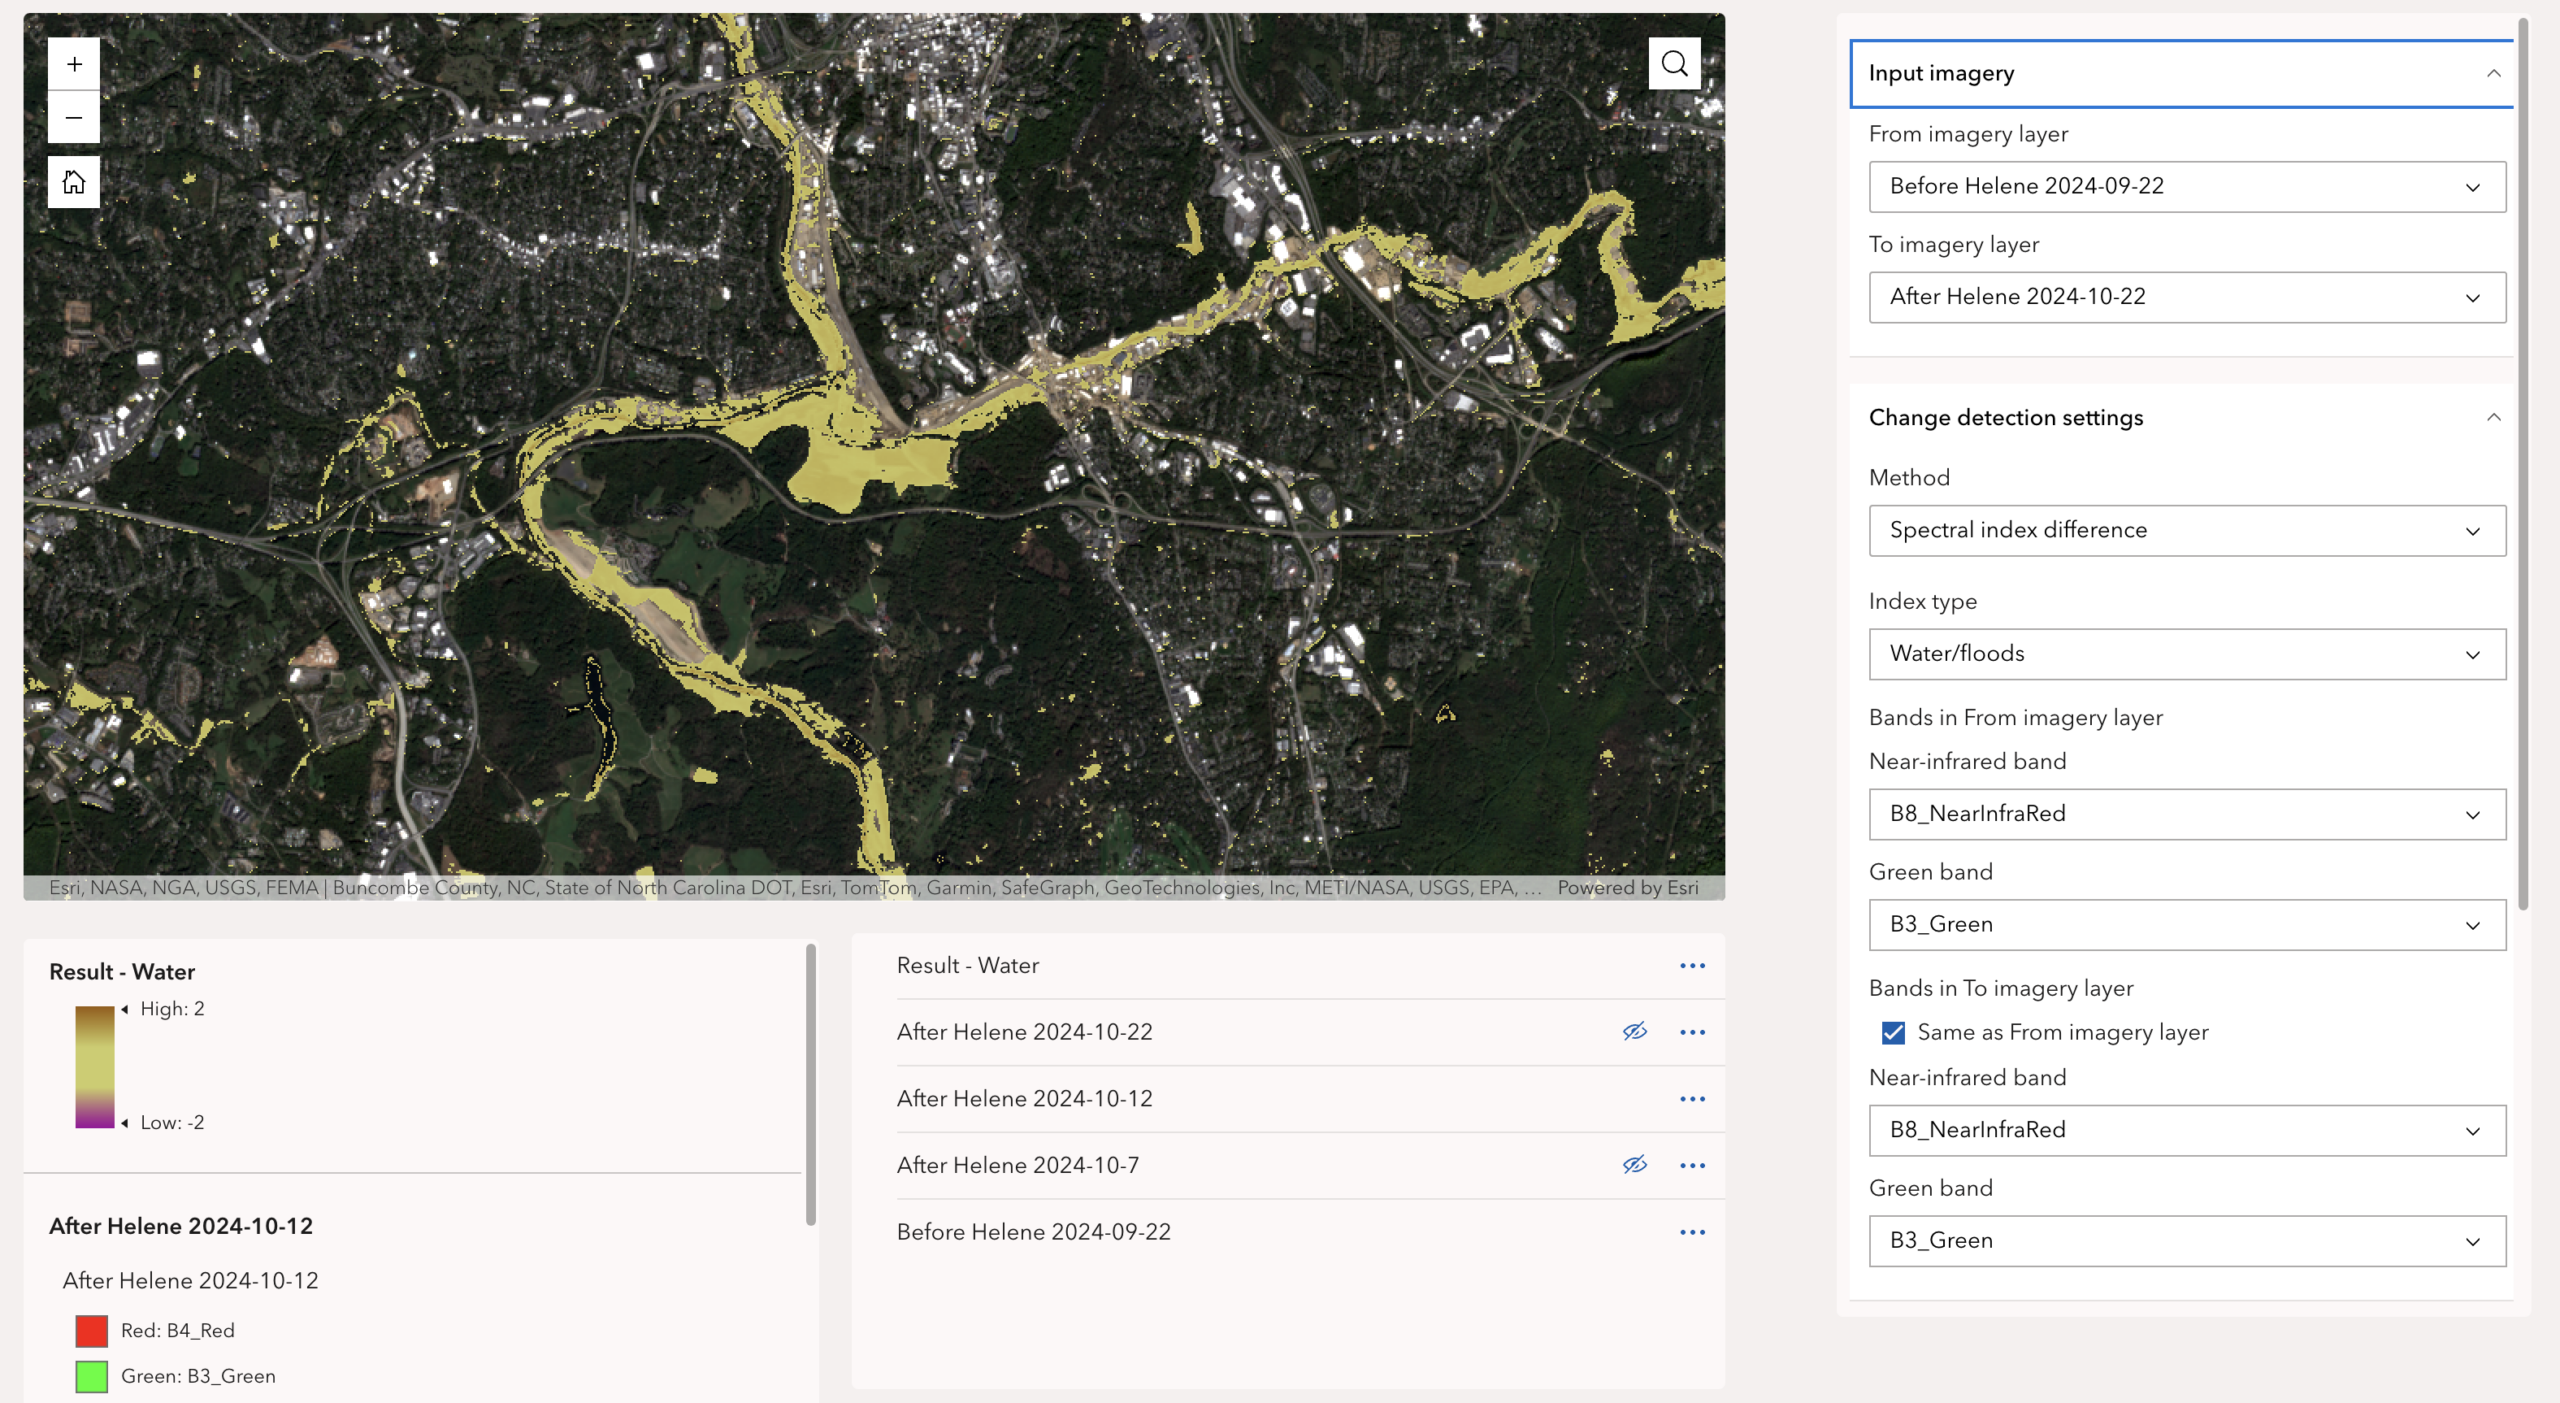
A new imagery widget, Image Change Detection, has been added to ArcGIS Experience Builder. This powerful new tool compares two imagery layers with a method you choose and create a difference imagery layer where each pixel contains the magnitude of change.
How It Works
- Flexible inputs: Use imagery layers directly from a web map created in the Map Viewer and added in Map widget, or selected imagery layers for your Area of Interest (AOI) straight from the Image Collection Explorer widget.
- Multiple methods: You can apply different change methods to explore potential changes, or find interesting changes in your AOI.
- Pixel-level output: Get an immediate visual representation where each pixel quantifies the magnitude of change, and type, such as flood, burn scars, vegetation change etc. if the method is image index change.
- On-the-fly results: The widget instantly generates a difference imagery layer based on your current view. As you pan or zoom, it continues updating the result layer simultaneously for a smooth, uninterrupted user experience.
Note: A Dynamic imagery layer is required as input of the widget.
Below is the result layer mapping the flooded areas in Asheville, NC, following hurricane Helene in 2024.
Item details assistant (beta)
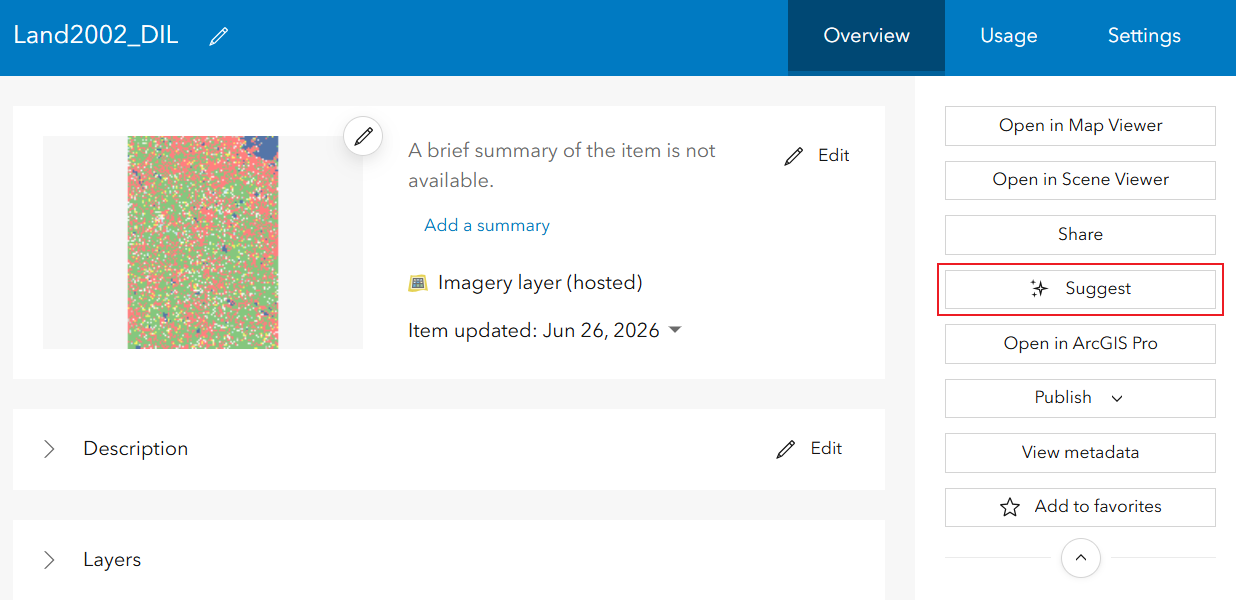
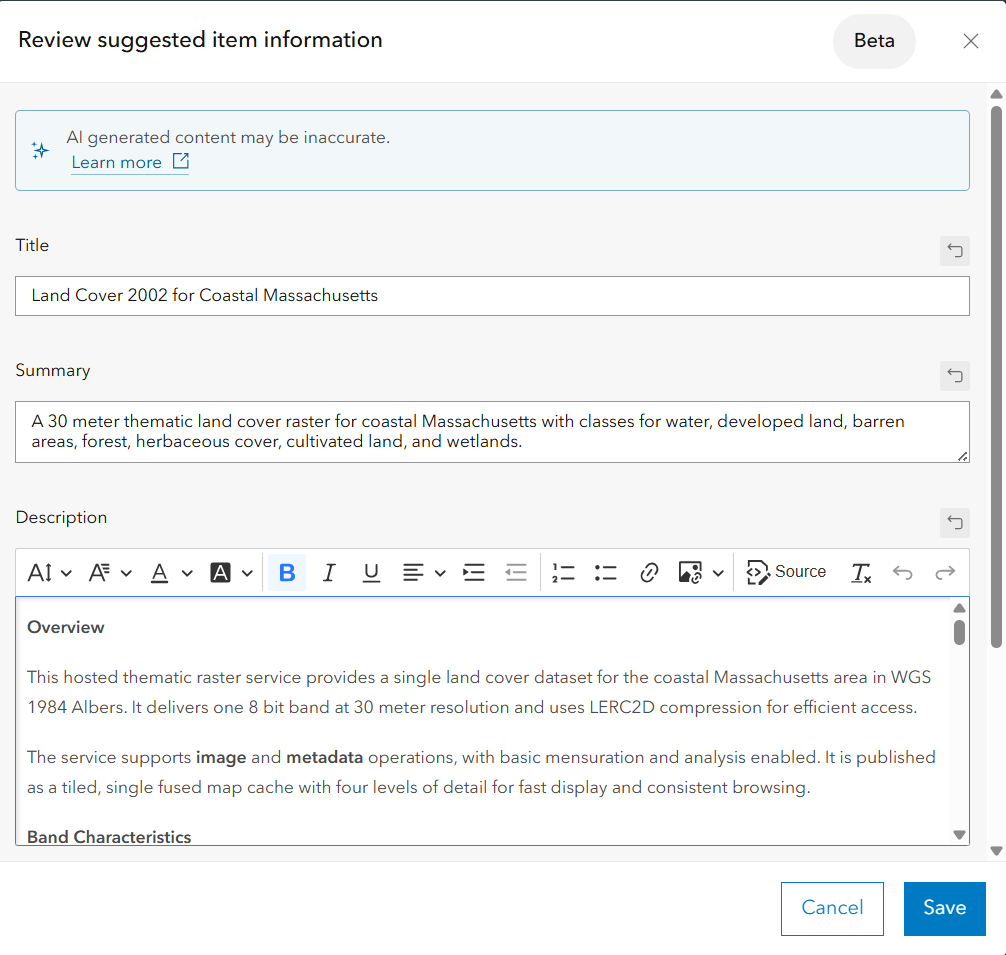
The Item details assistant will suggest updates to the Item Details page for your items including imagery layers. The suggestions will augment the existing metadata about your layer and can provide inform users of the layer about details present within the layer and add tags to allow the layer to be found more often.
Oriented imagery enhancements
New Ways to add Video to ArcGIS Workflows with Oriented Imagery
Oriented imagery is a cross‑ArcGIS capability that enables you to work with street‑level imagery, video, and hard-to-map oblique images taken from above. This enables you to better understand what you’re looking at on the ground and where it’s located, using views from any angle your device can capture, all within the context of a map. With the latest release of ArcGIS Online, there are several oriented imagery updates that enable the use of video within ArcGIS workflows. You can now host and manage video alongside your other GIS layers, so video is easier to organize, share, and use as part of the same system as the rest of your GIS content. Video layers can also be viewed in 3D using Scene Viewer, allowing you to add critical spatial context to better understand perspective and how what’s on the ground relates to surrounding features. And, video can now be captured as part of routine field work and saved directly as an oriented imagery layer, allowing imagery collected in the field to flow straight into ArcGIS Online and become immediately usable in maps and decision‑making.
Ready to take the next step?
As an ArcGIS Online user, you can start exploring these new imagery capabilities today. The Product Team is interested in your thoughts and ideas as you explore. Influence the direction of future releases when you visit us and leave a comment via the Imagery in ArcGIS Online community on Esri Community.
Interested in seeing how others are using imagery in ArcGIS Online? Check out stories from Skytec, LLC, the City of Johns Creek, and the National Trust from the UK.
As an ArcGIS Online user, you can start exploring these new imagery capabilities today. Read blogs on the latest practices and tools such as, mapping mangrove dynamics with raster functions or choosing the perfect imagery layer. Explore the tutorial gallery.





Article Discussion: