As we welcome the new year, it’s a perfect opportunity to look back on the progress we’ve made and celebrate our achievements. With that in mind, we’d like to highlight some of the tools developed and released by the Spatial Statistics Team in ArcGIS Pro 3.0, including new additions to the geostatistical and space-time pattern mining toolboxes. These tools have helped us to better analyze and understand spatial and temporal data, and we look forward to continuing to push the boundaries of what’s possible in the coming year.
Multiscale Geographically Weighted Regression (Spatial statistics toolbox)
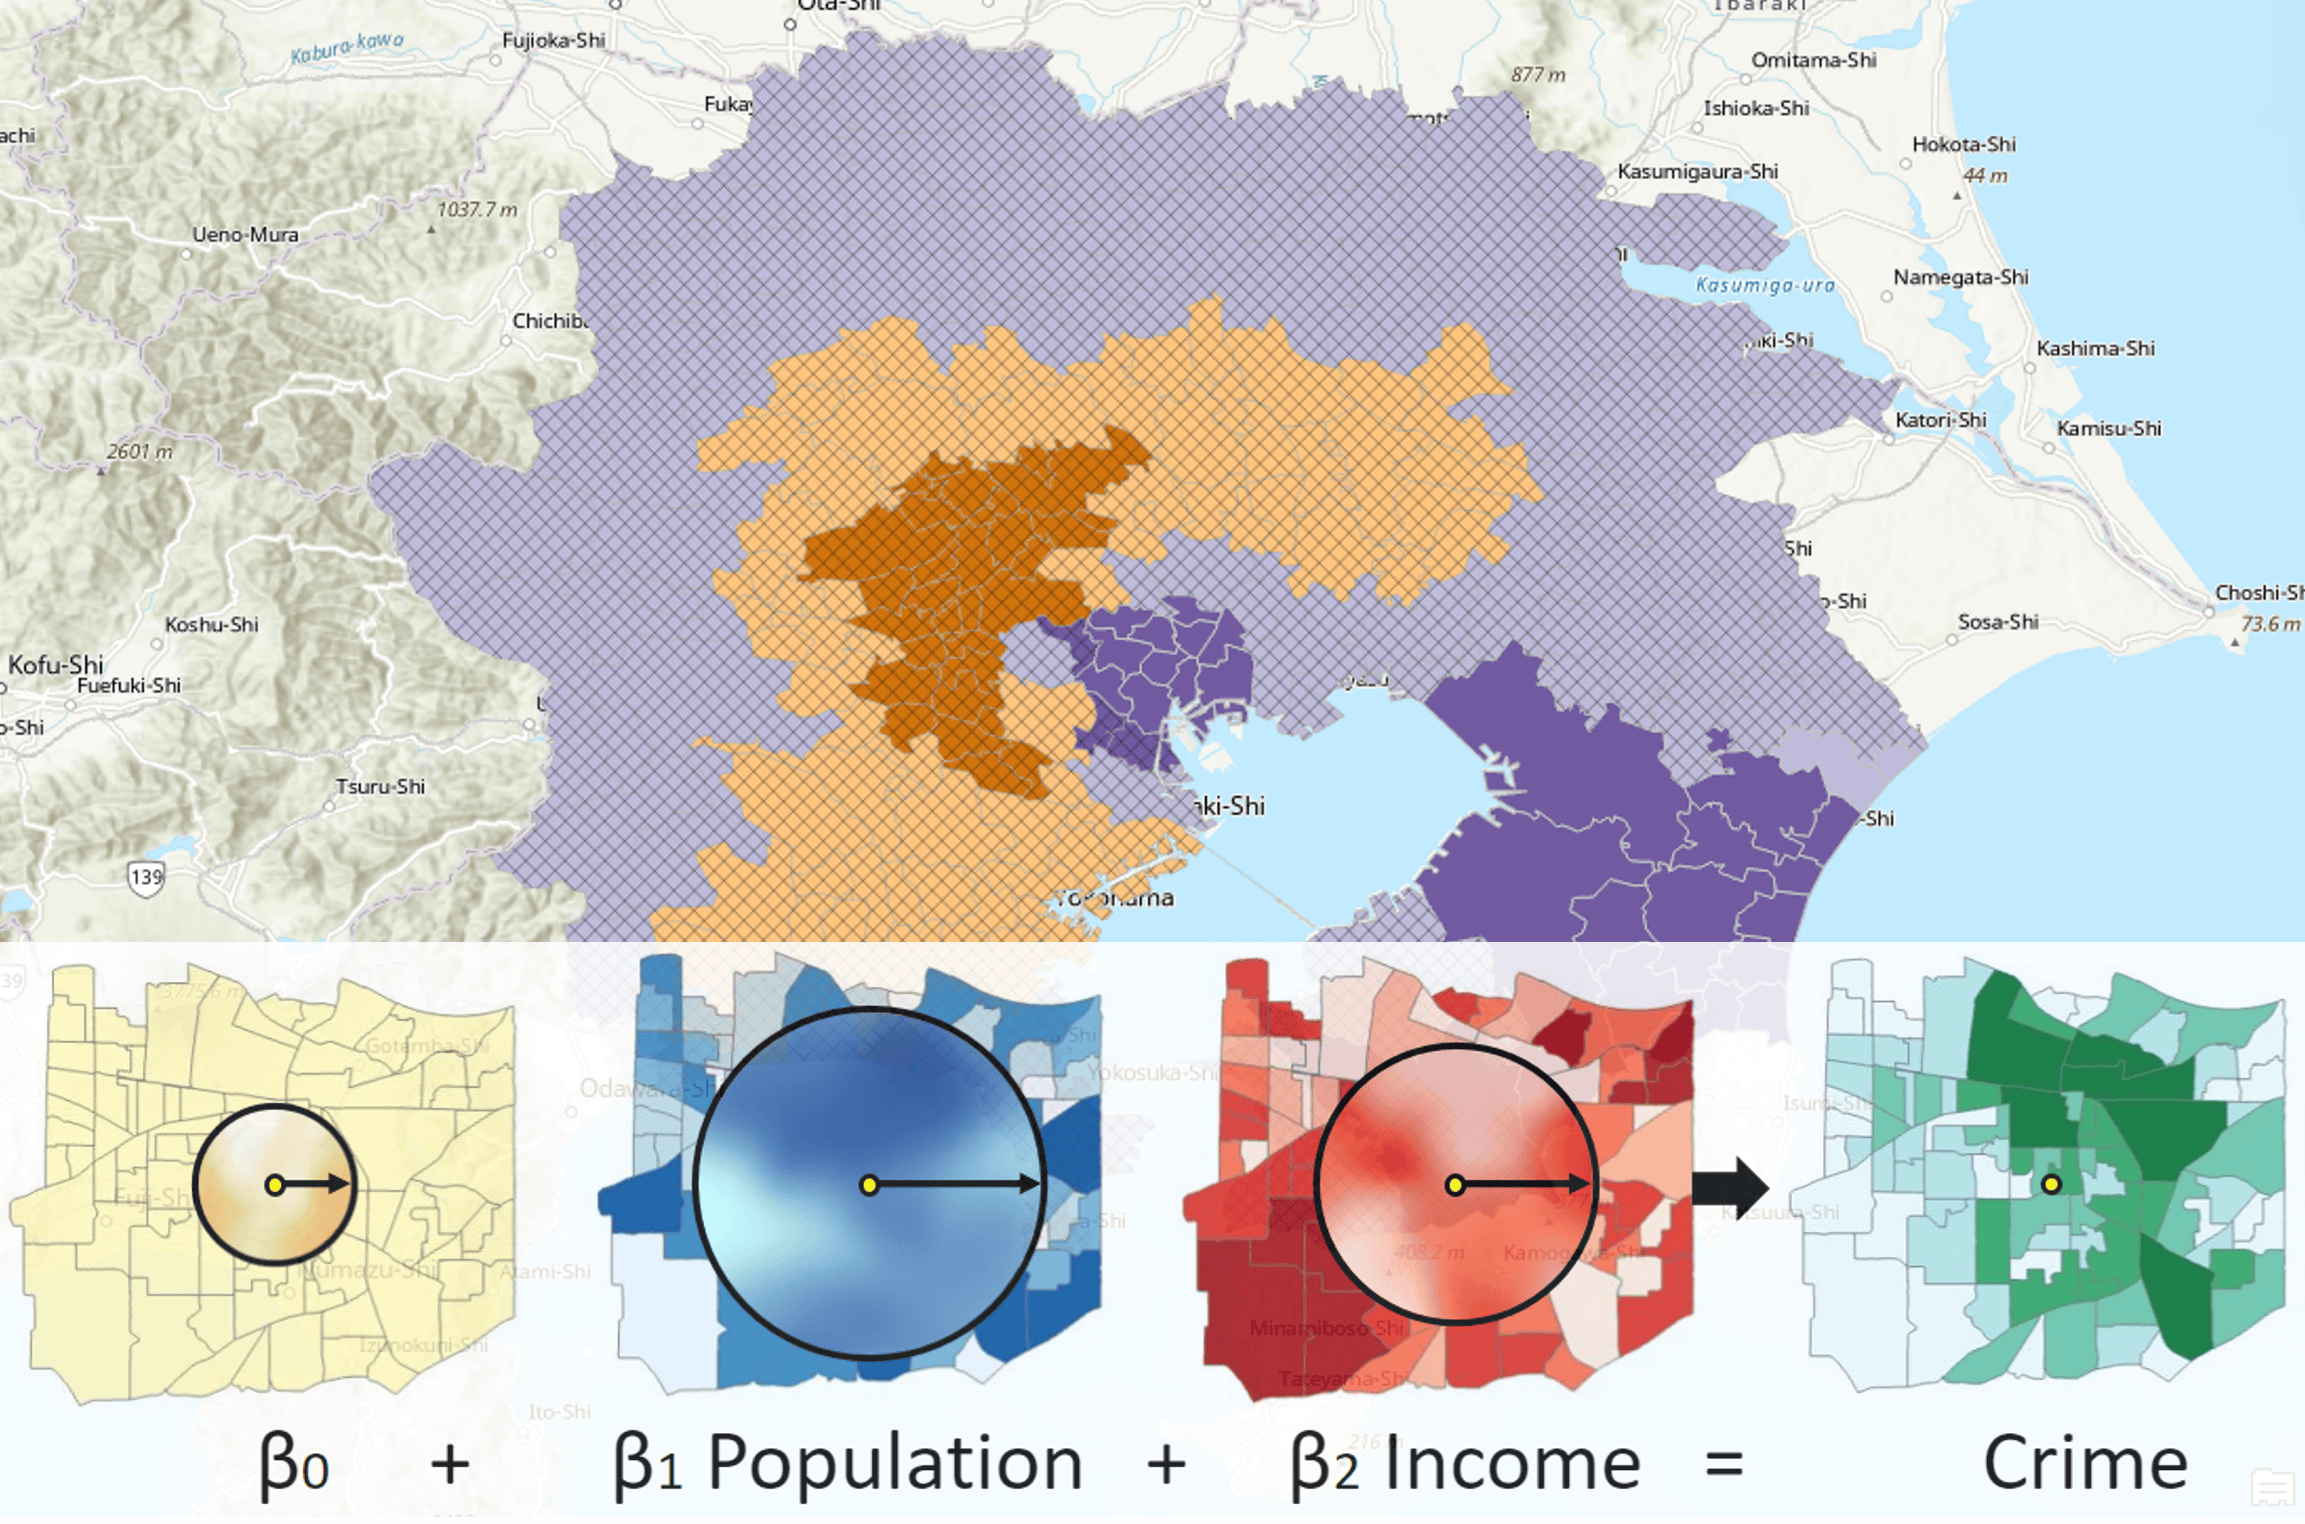
Multiscale Geographically Weighted Regression or MGWR is a statistical method used to model spatial data that varies over different scales. It evolved from the Geographically Weighted Regression (GWR) models that use explanatory and dependent variables within the neighborhood of a target feature to construct a local linear regression model for interpretation or prediction. In GWR models, it is assumed that the neighboring scale of each explanatory variable is identical; in MGWR, it is not. In MGWR, the coefficients of the regression model are allowed to vary across different locations in the study area, rather than being estimated as a single, fixed value for the entire region. This allows for more accurate modeling of spatial data that exhibits significant variations at different scales, such as environmental, social, or economic data.
Describe Space Time Cube (Space time pattern mining toolbox)
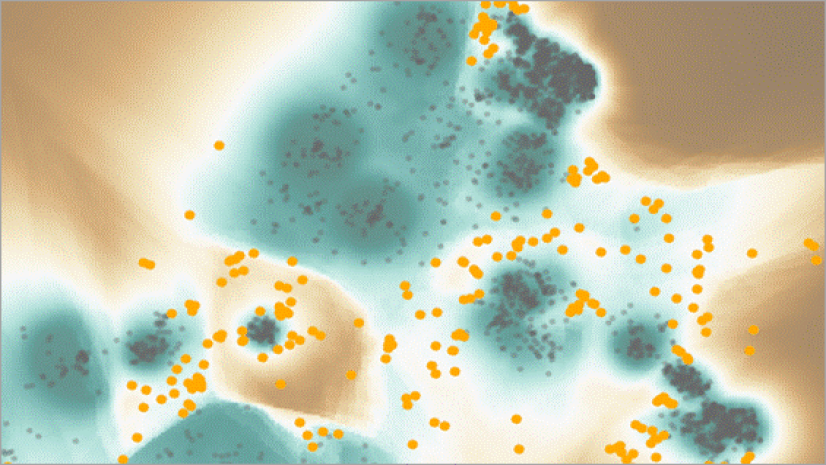
Space-time cubes are a powerful and increasingly popular way for understanding and visualizing the relationships between temporal and spatial data, but they can sometimes feel like a “mystery box” – it can be difficult to fully understand how they were created and what analyses they contain. That’s where the Describe Space Time Cube tool comes in! This tool helps to demystify space-time cubes by providing a summary of their contents and characteristics. With the Describe Space Time Cube tool, you can learn about the temporal and spatial extent of the cube, the variables it contains, the analyses that have been performed on those variables, and the 2D and 3D display themes available for each variable. In short, it’s a one-stop shop for gaining a deeper understanding of your space-time cubes.
Subset Space Time Cube (Space time pattern mining toolbox)
Do you need to extract only a specific region or time period from a space time cube? Subset Space Time Cube is the solution you need. This tool allows you to select a spatial or temporal subset of your space-time cube, giving you the flexibility to focus on the data that is most relevant to you. Simply choose the subset method that best fits your needs, and the tool will output the locations and bins of the input space time cube that meet your criteria. Whether you want to analyze data for a single country or exclude certain time steps from your analysis, Subset Space Time Cube has you covered.

Exploratory Interpolation (Geostatistical analyst toolbox)
With this tool, you can generate a variety of interpolation results from your input point features and field, and then compare and rank them using customizable criteria based on cross validation statistics. You have the option to rank the results based on a single criterion, such as the highest prediction accuracy or the lowest bias, or you can use a weighted average rank of multiple criteria. If you want to get really fancy, you can even use hierarchical sorting to prioritize certain criteria over others. And don’t worry about low-quality results ruining your analysis – you can set exclusion criteria to exclude any interpolation results that don’t meet your standards.
Compare Geostatistical Layers (Geostatistical analyst toolbox)
Are you ready to take your interpolation skills to the next level? Just like Exploratory Interpolation, Compare Geostatistical Layers tool allows you to compare and rank multiple geostatistical layers that you might already have using customizable criteria based on cross validation statistics. The output is a handy table summarizing the cross-validation statistics and ranks for each interpolation result, and you can even output a geostatistical layer of the highest-ranked interpolation result for further use in your workflows. It’s time to let your interpolation skills shine!

As we continue to develop new tools, we have also made updates and improvements to some of our existing tools to ensure they remain current and able to meet the evolving needs of data analysis. Some of these enhancements include:
- Geographically Weighted Regression (GWR)—The Scale Data parameter can be used to scale all explanatory and dependent variables to a standardized scale.
- Change Point Detection—The Slope option in the Change Type parameter detects changes in the slope (linear trend) of the values of each location of a space-time cube. The Minimum Segment Length parameter defines the minimum number of time steps between each change point.
- Forest-based Forecast—The Model Scale and Cluster Variable parameters allow building a single forecast model used for all locations or building a different model for each time series cluster. Additionally, estimation of confidence intervals is improved.
We also released a series of short videos and blog posts highlighting the capabilities of the Data Engineering view in ArcGIS Pro.
In 2022, we not only focused on building new tools, but also welcomed new members to our Spatial Statistics Team. If you’d like to get to know our team and learn about our current work and latest workshops, be sure to visit our team’s resource page. We’re always excited to share what we’re working on and learn from our colleagues in the community. Wishing you all a happy and prosperous 2023.


Article Discussion: