ArcGIS Pro 3.1 has just been released and we are excited to share with you the many new and improved capabilities available for your spatial statistical workflows. From the Calculate Composite Index tool, which allows you to combine multiple numeric variables into a single index variable, to the Predict Using Spatial Statistics Model File tool, which enables you to make predictions for new data using a previously trained spatial statistics model file, these new capabilities are sure to enhance your analysis workflow. So, let’s dive in and explore these tools in more detail!
Calculate Composite Index (Spatial Statistics)
An index is a numerical value that can be used to provide insight into a wide range of topics, such as social vulnerability or business innovation. The Calculate Composite Index tool is a powerful resource that enables you to create an index by combining multiple variables into a single variable. The tool follows a three-step workflow to preprocess the variables, combine the variables, and postprocess the index. By leveraging this tool, you can effectively analyze complex data and gain valuable insights that can be used to inform your decision-making.

Hot Spot Analysis Comparison (Spatial Statistics)
Hot spot analysis is a widely used technique employed by analysts and researchers to identify areas with statistically significant high or low values of a given variable. Many of you have been requesting ways to compare the results of two hot spot analyses, and we’re excited to introduce a new tool that enables you to do just that!
The Hot Spot Analysis comparison tool compares two hot spot analysis result layers and measures their similarity and association by examining the significance level categories of corresponding features in both input layers. The similarity metric assesses how closely the hot spots, cold spots, and non-significant areas of both hot spot results align spatially. Meanwhile, the association metric measures the strength of the underlying statistical relationship between the hot spot variables, similar to how correlation measures the association between continuous variables.

Introducing the new Spatial Statistics Model File (.ssm)
A spatial statistics model (.ssm) file is a new file type that contains the trained model, properties, and model diagnostics of an analysis performed by several tools in the Modeling Spatial Relationships toolset. You can use a spatial statistics model file to make predictions using new datasets and securely share it with others who can use it with their data. For example, a wildlife ecologist can collect field data of known locations of an endangered species and build a model to predict other likely locations of the species within their study area. They can then share the .ssm file with other ecologists who can use it predict locations of the species within their own study areas. Because the data used to train the model is not stored in the .ssm file, the highly sensitive original locations of the endangered species will not be revealed by sharing the model file.
You can use the following tools to manage and predict with .ssm files:
- Set Spatial Statistics Model File Properties—Set the properties of an .ssm file, including variable descriptions and units. This allows you to explain the variables of the model and their units so that others can use the file appropriately. For example, you can specify that an explanatory distance feature represents distances to hospitals measured in U.S. miles so that others can know to only use the model for a particular type of data.
- Describe Spatial Statistics Model File—View the properties of an .ssm file, including the analysis method, dataset names, properties, and model diagnostics. This allows you to understand what each variable means so that you can correctly match all variables, datasets, and units when using the file to make predictions with new data.
- Predict Using Spatial Statistics Model File—Use the .ssm file to make predictions with new datasets. You must match each variable or dataset in the .ssm file with a new dataset that has the same type and unit. For example, an explanatory variable in the model file may require a raster of temperatures values measured in degrees Celsius.
You can create an .ssm file using the new Output Trained Model File parameter in the following tools:
- Generalized Linear Regression
- Forest-based Classification and Regression
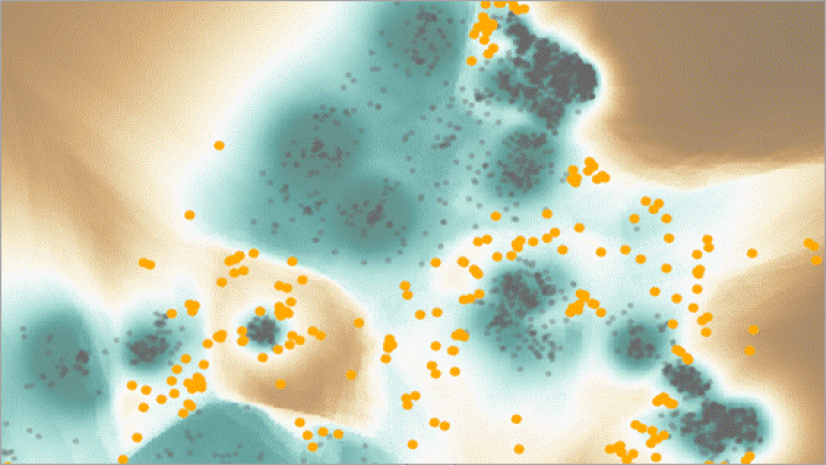
- Presence-only Prediction (MaxEnt)
Learn more about Spatial Statistics Model File

Nearest Neighbor 3D (Geostatistical Analyst)
The new Nearest Neighbor 3D tool creates a voxel layer source file (netCDF) from categorical 3D points by assigning each voxel the categories of the nearest neighbor in 3D. A voxel layer represents multidimensional spatial and temporal information in a 3D volumetric visualization.

Multiscale Geographically Weighted Regression (MGWR) (Spatial Statistics tool enhacement)
The MGWR tool has a new neighborhood type called Gradient Search which estimates the optimal bandwidths for each explanatory variable using a gradient-based optimization algorithm. This approach is faster and provides more efficient memory usage.


Article Discussion: