Water resources management is the process of controlling flow and allocating available water for beneficial applications. Water management planning and implementation impulses development and aims to achieve sustainable use of water. Besides, the water resources management process requires knowledge of how water moves in the basin. The basin water balance equation follows the conservation of mass principle:
P – ET = Q ± ΔS
Where P is the precipitation (input), ET is the consumed water as evapotranspiration (output), Q is the runoff, and ΔS is the change in storage in the system (e.g. lakes). The term P – ET is known as the Available Water (AW), it is a key component of the hydrologic cycle. AW is the net flux into the basin in a period. It can be positive (surplus) during the rainy season and negative (deficit) in the dry season. is related to the storage capacity and how much water is available for other water uses such as urban water supply or industrial.
The variability of AW throughout the year puts additional pressure on water resources in a basin during the dry season. Moreover, in transboundary rivers such as the Jordan River Basin, riparian countries might have different priorities. Understanding Available Water and the operation of the water balance in the basin are the baselines for supporting hydrodiplomacy and international cooperation in the region.
In this blog, I use layers in ArcGIS Living Atlas of the World to analyze Available Water in the Jordan River Basin: (1) Monthly Satellite Precipitation Estimates (IMERG) and (2) Monthly Actual Evapotranspiration (SSEBop). Both layers are time-enabled multidimensional image services, meaning that monthly precipitation or evapotranspiration rasters are accessible but also the full time series for analyzing temporal or seasonal variability.
Contrasting water fluxes
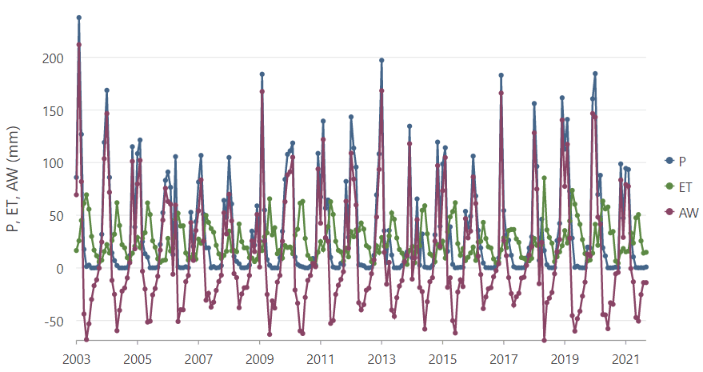
There is a contrasting seasonality between precipitation and evapotranspiration in the Jordan River Basin. Precipitation occurs during the winter months, while evapotranspiration peaks in the summer months when the temperature is higher.
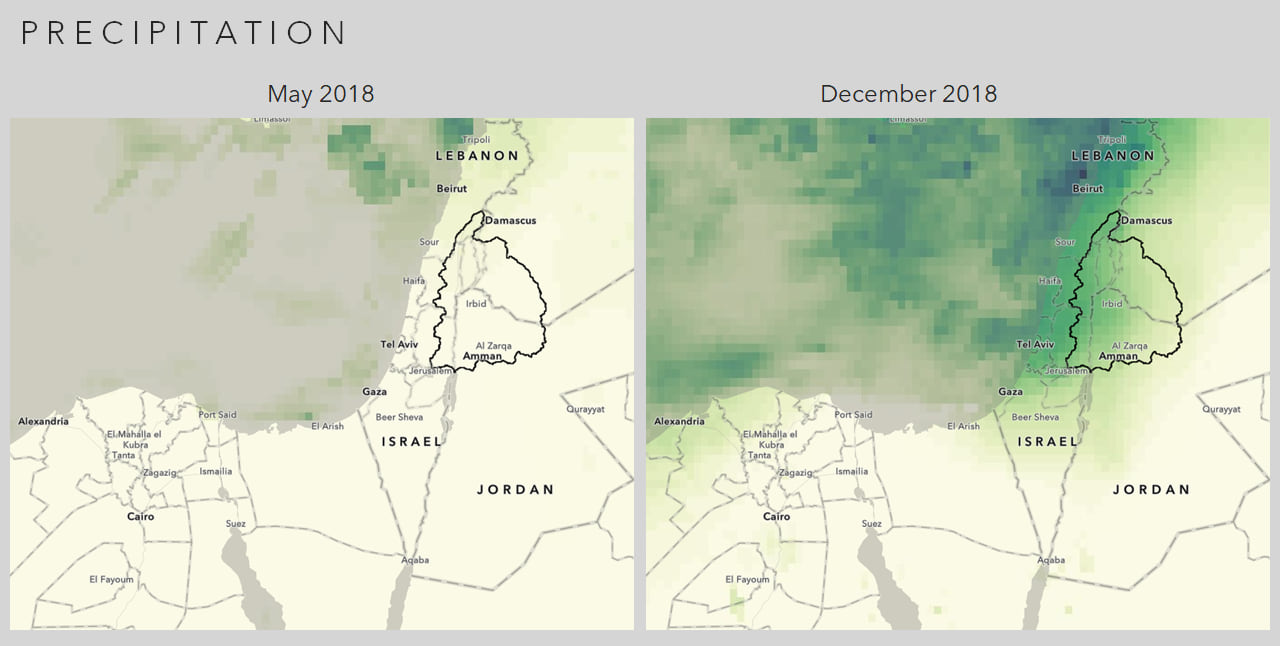
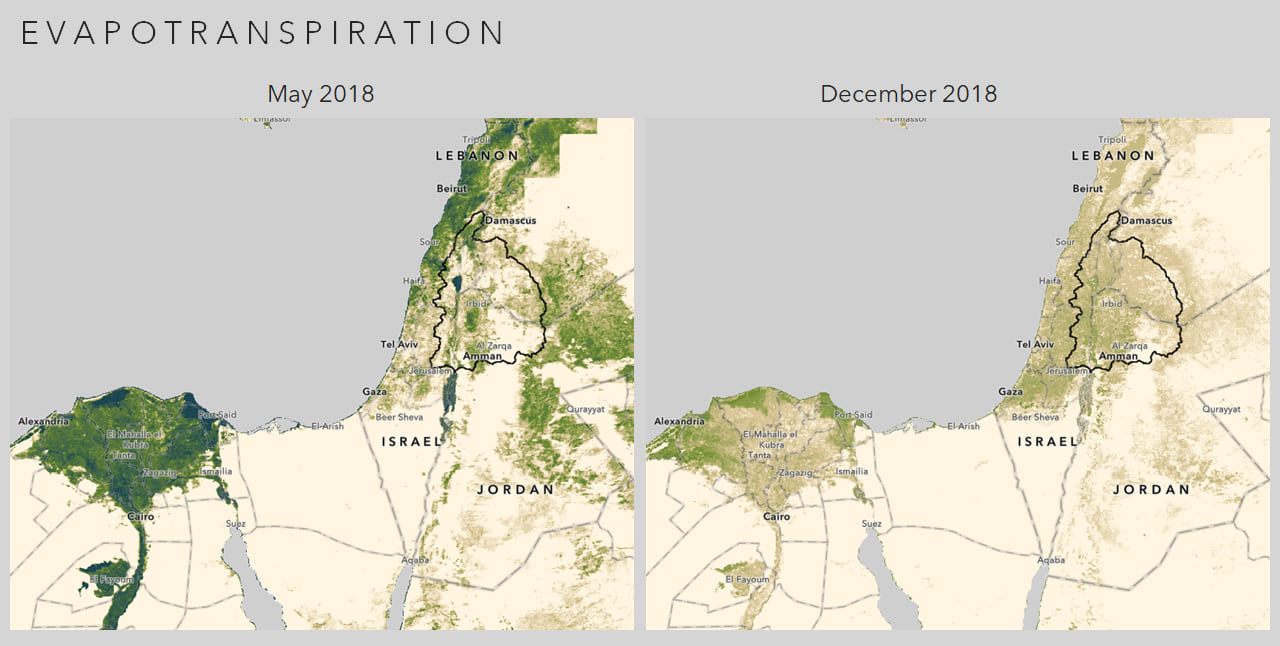
Seasonality
The seasonality of precipitation and evapotranspiration produce a marked regime in Available Water. Available Water has a surplus during the rainy season and a deficit over the summer months. For example, water stored in the rainy season is used to irrigate crops in the summer months.
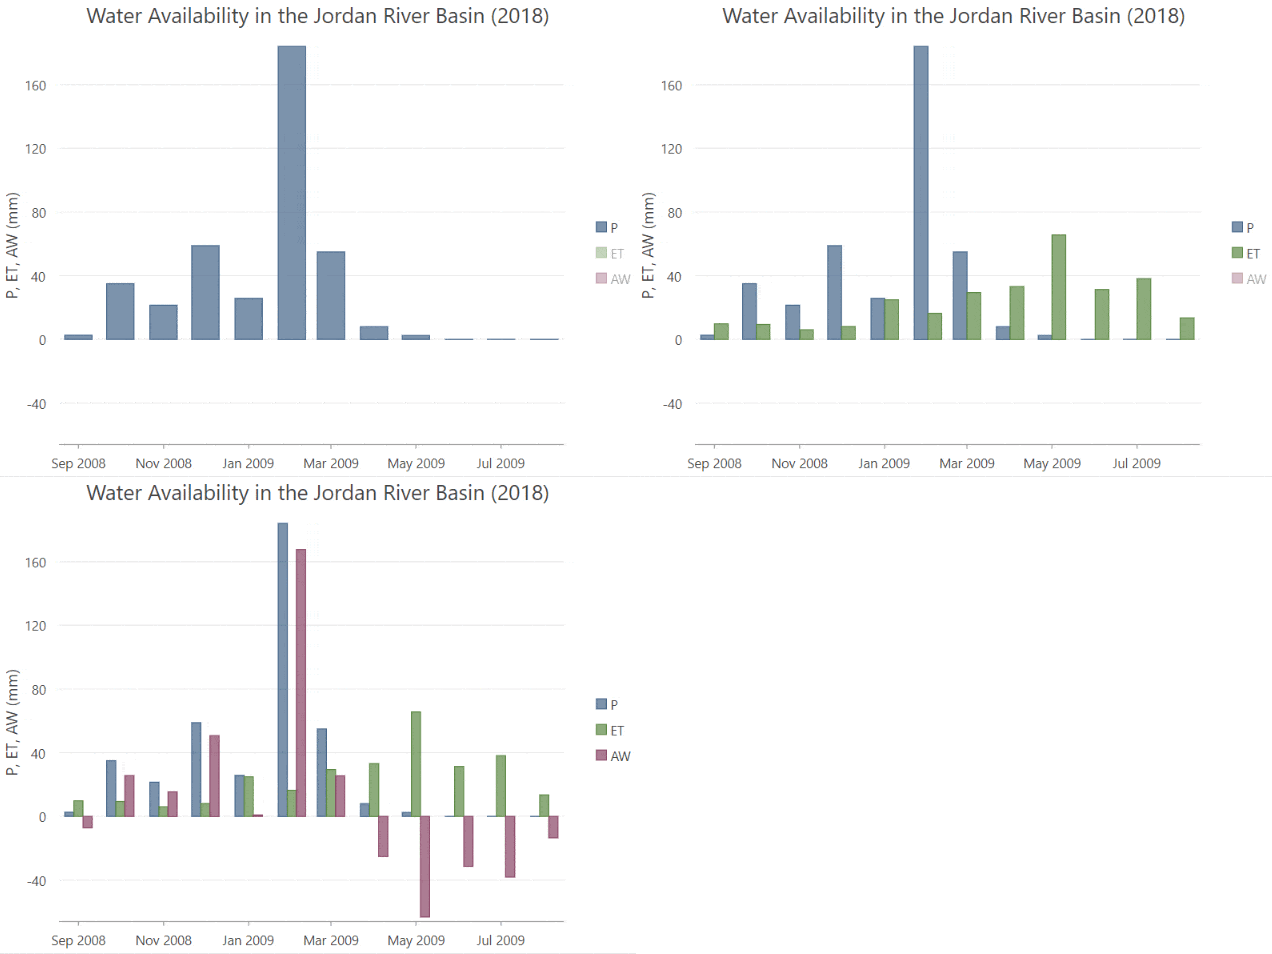
Note: I used ArcGIS Pro for this plot. I started by running the Zonal Statistics tool to get mean precipitation and evapotranspiration in the Jordan River Basin. Then I joined the tables and calculated a new field (AW = P – ET). Finally, I created a bar chart for the water year of 2018 (i.e. September 2018 to August 2019).
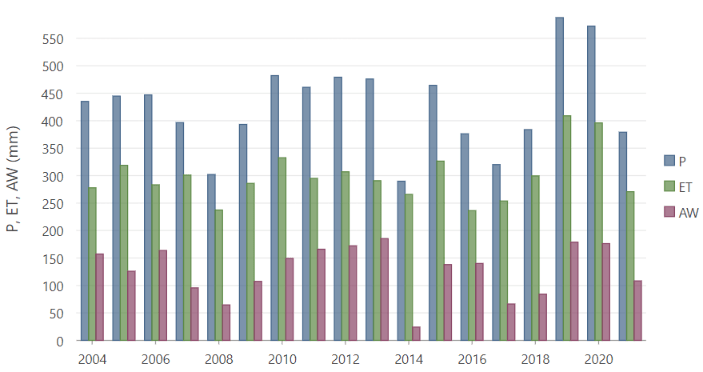
Similarly, the annual and monthly plots show the variability of Available Water in the Jordan river basin. Identifying when water stress periods and the extent of dry seasons.
Available Water Map
The available water map for the water year 2020 (i.e. from September 2020 to August 2021) shows the areas where precipitation is greater than evapotranspiration (blue) and areas where evapotranspiration is larger than precipitation (red). The latter areas (AW < 0) depend on flows and diversions from areas with more precipitation than evapotranspiration (AW > 0).
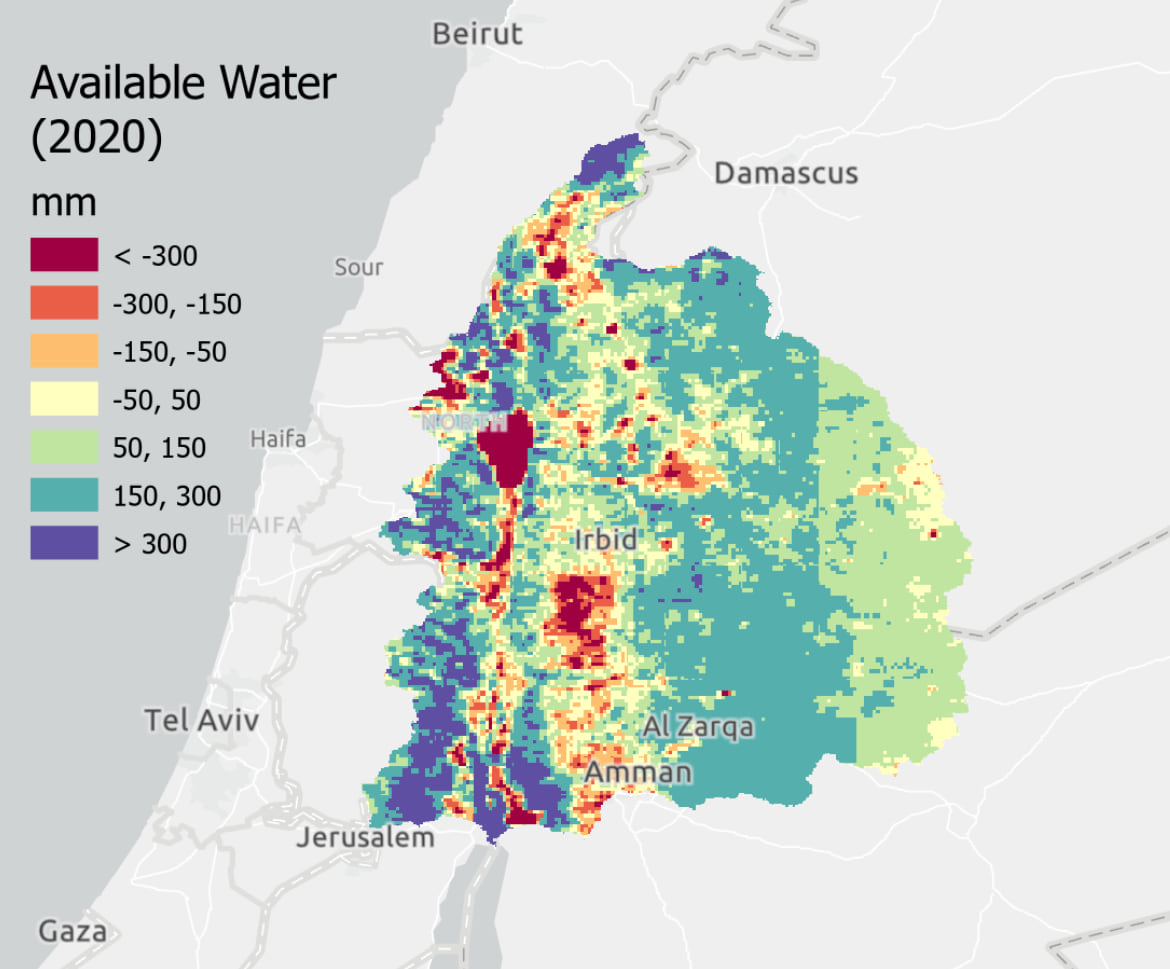
For example, in large open water bodies like Lake Tiberias, AW is lowest. The water flow into the lake from precipitation is significantly less than the one from its tributaries so it has more water to evapotranspirate than the one it receives from direct precipitation. Agricultural areas with intensive irrigation schemes also show negative AW because these areas evapotranspirate water that precipitated in other parts of the basin and was diverted into them. In addition, there are cases where water is transferred outside of the basin, so it is consumed and measured as evapotranspiration in a different administrative area.
Summary
Living Atlas includes multidimensional image services like precipitation and evapotranspiration that are supporting water resources management studies. Understanding Available Water in a basin can reduce water stress in dry seasons, help moving toward sustainable use of water, and draw a baseline knowledge for supporting international cooperation, such as in the Jordan River Basin.
More Information?
Join the Esri Community and ask questions to Living Atlas experts.


Article Discussion: