Evapotranspiration (ET) is a key component of the water cycle and is useful for many analysis and mapping applications. A new time-enabled imagery layer with monthly ET measurements is now available in Living Atlas.
Understanding Evapotranspiration
Evapotranspiration represents the water that flows from the landscape into the atmosphere. ET combines the water fluxes from (1) direct soil evaporation, (2) evaporation from intercepted precipitation on trees, branches, and leaves, and (3) transpiration from plants.
Evapotranspiration is a complex physical process. It is dependent on temperature, humidity, wind speed and other atmospheric conditions. ET is difficult to measure with traditional methods. Estimates from remote sensing and global models provide useful ET values for a range of applications, from calculating water balances to assessment of water consumption. ET is part of the earth’s water balance, having a time-series of spatially uniform ET data sets is a scientific step forward.

The Operational Simplified Surface Energy Balance (SSEBop)
The Operational Simplified Surface Energy Balance (SSEBop) is a remote sensing-based model that provides evapotranspiration estimates. SSEBop uses the Simplified Surface Energy Balance (SSEBop) model and ET fractions from NASA’s Moderate Resolution Imaging Spectroradiometer (MODIS) and predefined parameters for operational applications.
Time-enabled image service
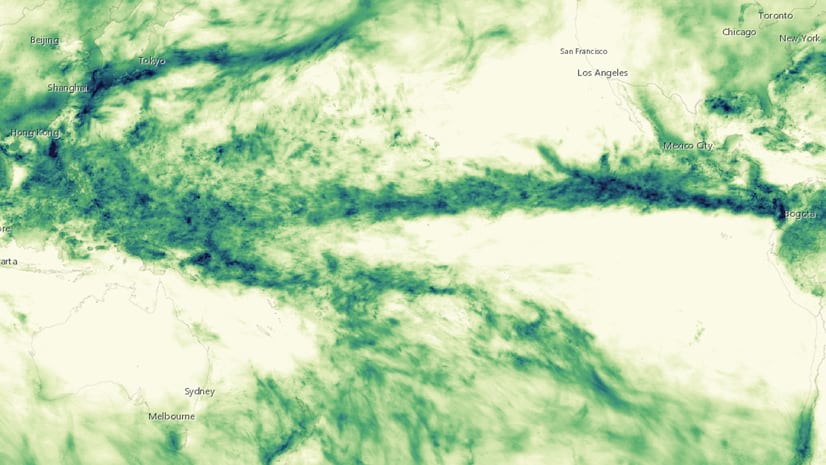
The Monthly Actual Evapotranspiration (SSEBop) image service in Living Atlas provides monthly ET rasters from January 2003 to the present with a 0.01 degrees (~1km) spatial resolution. As a time-enabled image service, the evapotranspiration layer shows seasonal changes across the landscape from dry seasons to rainy seasons and the greening of the vegetation.

Live Feed updates
The Monthly Actual Evapotranspiration (SSEBop) image service is automatically updated every month as new data becomes available. The update process is carried out by a live feed routine. This live feed routine allows the service to display the latest information available seamlessly without service interruptions.
Using ET Information in GIS
Conservation of ecosystems
High evapotranspiration values during dry seasons in natural areas such as wetlands or deltas show how these ecosystems are dependent on upstream water flows. A basin-wide integrated water resources management (IWRM) approach can be implemented to carry out development while also promoting conservation of critical areas.
The Okavango River Delta is a unique ecosystem, its wetland accommodates one of the largest and most diverse assemble of plants and wildlife in the world. The Okavango River floods the wetland during the dry season, supporting the local and regional biodiversity at this critical time of the year. As an inland Delta, the water of the Okavango River does not reach the ocean, thus its water flow is eventually measured as ET.
Monitoring protected areas
Evapotranspiration can be used to monitor the health of vegetation in protected areas, providing an early warning during dry spells. Moreover, sharp decreases in ET in a region support the efforts to identify illegal development areas and landscape transformation activities.
In the states of Pará and Mato Grosso in Brazil, ET highlights the difference between protected areas and areas under development. In areas under development, the forest cover has decreased and therefore the natural process of ET has been reduced. Areas subject to some degree of environmental protection as those shown in the World Database on Protected Areas (WDPA) have maintained their seasonal ET patterns.
Assessment of water consumption
ET can be used to estimate consumed water in a basin. In water scarce regions, the volume of consumed water as ET from crops can be linked to the depletion of groundwater resources used.
The crop circles in Saudi Arabia are located in an arid region that receives around 40mm of rainfall per year. Food production in this area relies on irrigation from non-renewable groundwater resources. ET can be used to monitor consumed water in irrigation.
Conflict, population displacement, and food production
The onset of the civil war in Syria had different angles: economic, sociopolitical, regime change, but also climate variability. Conflicts in Syria were intensified by drought and water stress, migrations to urban centers generated food insecurity. Population and Armed Conflicts data in Living Atlas can help understand the complexity of conflicts and the influence of water stress in them.
Could the war in Ukraine generate food shortages in the world? GIS and Living Atlas layers can be used to answer this question.
Summary
Evapotranspiration is a key process of the water balance. It quantifies water fluxes from the landscape into the atmosphere. ET is a complex hydrological process, but it can be estimated by remote sensing-based global models. The Monthly Actual Evapotranspiration (SSEBop) item in Living Atlas provides monthly ET rasters, this image service is automatically updated by a live feed routine. ET data in Living Atlas can be used for a range of environmental and water resources applications such as conservation of ecosystems, monitoring of protected areas, and assessment of water consumption.


Article Discussion: