Step 1: Create a wildlife conservation plan
As the director of Natural Resources for Vermont, you need to conserve the wildlife populations in your state that are being threatened by habitat fragmentation. Human encroachment is breaking up the contiguous forest into smaller isolated patches. To slow the rate of fragmentation, you need to prioritize which lands to protect and design a way to connect them.
Connecting isolated patches of habitat is important because it helps maintain biodiversity. When individuals from spatially discrete subpopulations interact, they form a metapopulation. This encourages genetic diversity and allows the species to recolonize a patch if the local population disappears.
You cannot individually consider each wildlife species, so you’ll design the conservation plan around an umbrella species. An umbrella species is one that is generally high on the food chain and that requires large areas of intact habitat. By focusing conservation efforts on an umbrella species, other species that live in similar habitats will also be protected. For this area of northern Vermont, the bobcat (lynx rufus) will be our umbrella species.
To create the conservation plan, you’ll use a suitability model. The steps for creating a suitability model are as follows:
- Identify the preferred criteria for the bobcat.
- Transform the values within each criterion to a common scale.
- Weight and combine the criteria and submodels.
- Locate the best habitat patches.
- Connect the habitat patches with wildlife corridors.
- Validate the results.
Step 2: Identify the preferred criteria for the bobcat
There are three main needs bobcats respond to when making decisions:
- A good habitat
- Access to food
- Security from humans
Each of these needs will be represented as submodels in our suitability model. Each submodel has a series of criteria the bobcats are reacting to:
| Habitat submodel | Dataset |
| Land use types with good cover and shelter | Land use |
| Steeper slopes | Slope |
| Close to water | Distance from streams |
| Food submodel | |
| Land use types with most available food | Land use |
| Close to known food sources | Distance to deer yards |
| Security submodel | |
| Far from roads | Distance from roads |
| Far from buildings | Distance from buildings |
The criteria for each submodel will be combined, and then the three submodels will be added together to create the final suitability map. In this blog we will focus on creating the habitat submodel.
Step 3: Transform the values within each criterion onto a common scale
Since the base criteria values vary in meaning, they need to be transformed onto a single suitability scale before you can add them together. In your case, you’ll employ a 1 to 10 suitability scale, with the most preferred attributes receiving the highest suitability value (10). For the habitat submodel, land cover areas that provide the most shelter, such as deciduous and coniferous forests, are preferred and will be classified as 8 and 9, respectively, while highly developed areas such as human settlements will be classified as 1 or 2. Steeper slopes are more preferred than flatter areas, and close proximity to water is also ideal.
*Note- You will need ArcGIS Pro with a license for the Spatial Analyst extension. If you don’t have this extension or access to ArcGIS Pro, get a free trial.
Steps:
1. Download the Bobcat Habitat data and unzip the file to the folder of your choice.
2. Inside the lesson data, open SuitabilityModeling.arpx.
This ArcGIS Pro project contains the data as well as the models that you’ll need to model the suitability corridors.

Data from the National Land Cover Dataset is displayed over a hillshade.
3. Explore the study site by turning the layers on and off.
This area in northern Vermont is just north of the state capital. The Green Mountains run north to south through the center of the study site and the area is mainly forested, but also populated by humans. To begin calculating the suitability surface, you’ll run a model to examine habitat.
4. On the ribbon, click the View tab and open the Catalog Pane.
5. In the Catalog pane, expand the Toolboxes folder and expand BobcatModel.tbx. Right-click SuitabilityModel and click Edit.

The ModelBuilder pane opens. The model weights the three criteria fundamental to bobcat habitats: land use, elevation, and water. You can follow the flow of the model and observe how the slope was derived from the elevation layer and how location distance to streams was derived using the Euclidean Distance tool. Now, you’ll reclassify the land use types to suitability values using the Spatial Analyst Reclassify tool.
6. In the ModelBuilder pane, under Transform Data, double-click Reclassify.

7. Enter the preference values as identified below and click OK.
- Developed High Intensity: 1
- Developed Medium Intensity: 1
- Developed Low Intensity: 2
- Agriculture: 3
- Grassland: 4
- Forest, Deciduous: 9
- Forest, Coniferous: 7
- Forest, Mixed Deciduous-Conifers: 8
- Scrub/Shrub: 10
- Wetland: 9
- Bare Land: 2
- Water: 1

8. Right-click Reclassify and click Run.
When the tool is finished running, a drop shadow will appear behind it.
Note: If you have trouble creating any output in the model, all outputs have been created for you and are stored in the Results.gdb file.
9. Click the Map tab. In the Contents pane, turn off all layers except Reclass_Land and LandUse.
10. Right-click Reclass_Land and click Symbology.
11. Under Primary Symbology, make sure Stretch is chosen. For Color scheme, check the Show names and Show all boxes, and then choose the Red-Yellow-Green (Continuous) color scheme.

You can explore the transformation by turning the Reclass_Land layer on and off. The forested areas that are most preferred are green. Least preferred areas, like human populated areas and water, are in red. Click around the map to see the suitability score of different areas.
Now you will transform the slope and stream proximity values using the suitability scale. Bobcats tend to prefer steep terrain with access to water. The Rescale by Function tool will allow you to account for the gradient in geoenvironmental preferences.
Steps:
1. Click the SuitabilityModel tab. In the ModelBuilder pane, double-click Rescale by Function (the second tool under the Transform Data heading). For Transformation function, choose Logistics Growth and click OK.

2. Right-click Rescale by Function and click Run.
The result is added to the Contents pane as Rescl_Slope. Explore the results in the Map pane.
3. In the ModelBuilder pane, double-click the Rescale by Function (2) tool (after the Euclidean Distance tool) and select the MS Small function.
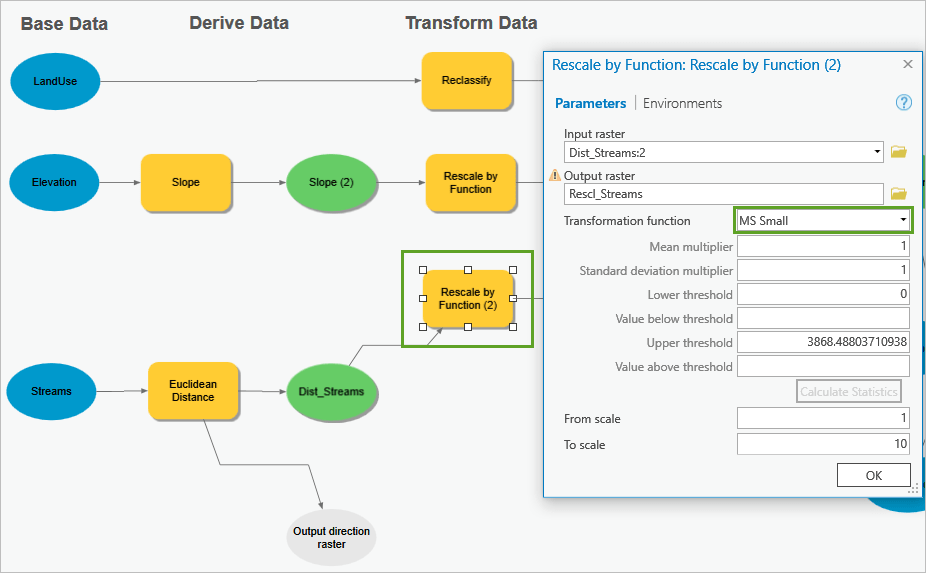
4. Click OK, and then right-click and run the tool.
The Rescl_Streams layer is added to the Contents pane.

MS Small is a transformation function that prefers smaller values. Click around the map to view the new values.
Step 4: Weight and combine the criteria and submodels
Now that all criteria have been reclassified using the same suitability scale, they can be added together to determine the most suitable areas. The result will consider all the layers and will prefer high values, such as 30, the most ideal habitat. The higher values will contain the bobcat’s preferred environmental factors, such as steep slopes, forested vegetation, and easy access to water.
Certain criteria are more important than others and can be weighted accordingly when combining them together. For the bobcat, land use is the most important and will therefore be weighted the heaviest.
Steps:
1. In the SuitabilityModel pane, open the Weighted Sum tool under the Weight and Combine: Criteria heading.
2. Enter the weights as specified below and click OK.
- Reclass_Land: 2
- Rescl_Slope: 1
- Rescl_Streams: 1
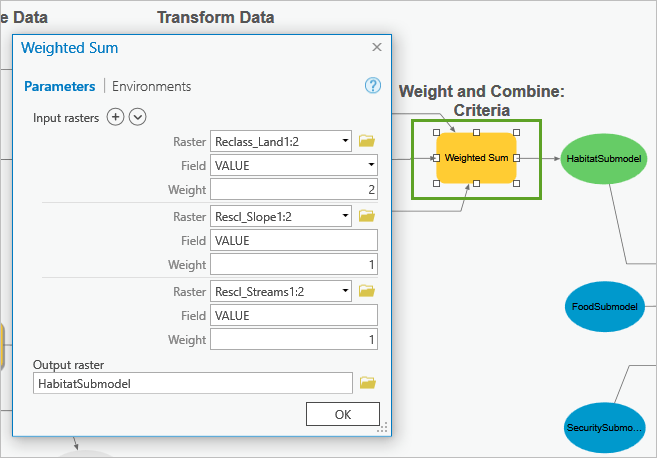
3. Right-click the tool and choose Run.
The food and security submodels were previously calculated and are ready to be combined with your habitat submodel. Food and security are most important to the bobcat in this study area, so those inputs will receive the highest weight.
4. Open Weighted Sum (2) (under Weight and Combine: Submodels).
5. Enter the following weights and click OK:
- HabitatSubmodel: 1
- FoodSubmodel: 5
- SecuritySubmodel: 5
6. Run the tool.
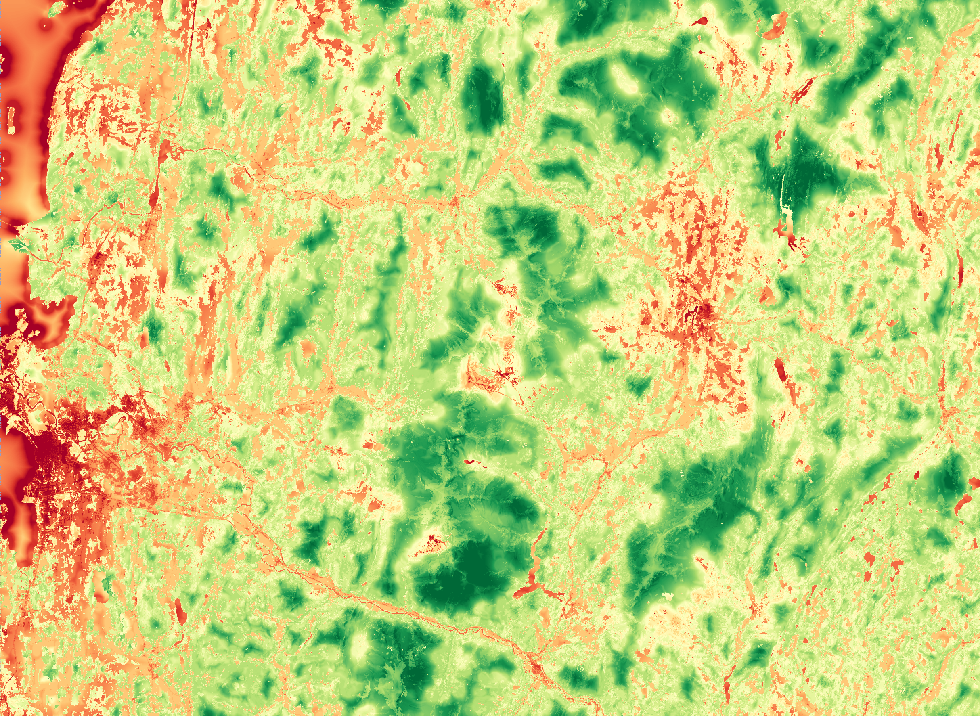
The most suitable habitats are green and the least suitable are red. Notice the locations that are forested, in the mountains, and far from humans are preferred by the bobcat.
Step 5: Locate the best habitat patches
In addition to the previous site requirements you calculated, bobcats also need a large range to establish their territory. To determine sites with enough carrying capacity to support a healthy bobcat population, you need to consider the following:
-
- Five habitat patches totaling 50 square miles.
- Patches must be 5–14 miles, and as compact as possible.
- Distance between patches should be 4–13 miles.
Steps:
1. In the SuitabilityModel pane, under the Locate heading, open the Locate Regions tool.
2. Examine the entered input parameters, and then run the tool.
The Locate Regions tool may take a few minutes to run.
3. Click the Map tab. In the Contents pane, expand the NewPatches layer and right-click the symbol swatch for 0. In the color palette, choose No Color.

Examine the output suitability map from above to see that the patches are located in areas most preferred by the bobcat (in darker greens).
Step 6: Connect the habitat patches with wildlife corridors
To make sure the bobcat can move between the patches to maintain bio- and genetic diversity, wildlife corridors need to be established.
Steps:
1. In the Catalog pane, expand the Toolboxes folder and expand BobcatModel.tbx. Right-click ConnectivityModel and click Edit.
The patches identified by the Locate Regions tool are the input. A cost surface raster that was previously calculated based on a mobility analysis for the region is the other input.
2. Run the Cost Connectivity tool, and then in the Map pane, turn off all layers except OptNetwork, NewPatches, ExistingRegion, and Hillshade.
The tool produces two outputs, NeighborPaths, which provides the least-cost path between all patches, and OptNetwork, which provides the overall least-cost path.

The final map is one of the first steps in identifying viable conservation areas.
Step 7: Validate the results
A proper conservation plan requires consulting with experts and the various stakeholders that would be affected by the project. You should communicate with wildlife experts about site suitability criteria, weights, and any other assumptions you are making. Local residents, environmental organizations, and government officials all need to be included in the decision making—your plan may be impossible without their consent. Finally, always ensure your data is up to date and consider making an in-person visit to the site to compare your results.
Although this model is suitable today, nature and environmental needs are always changing. Five months or five years from now, this region may have significantly transformed. Consider documenting your workflow for the future site suitability assessments.


Commenting is not enabled for this article.