ArcGIS Solutions helps you make the most of your GIS by providing purpose-driven, industry-specific configurations of ArcGIS.
In the ongoing quest for robust, equitable communities, governments globally are embracing racial and social equity initiatives. Acknowledging the impact of systemic barriers, many are renewing their commitment to understanding, mapping, and analyzing challenges faced by marginalized communities.
At the federal level, there has been a renewed push to incorporate an evidence-based approach to equitable policymaking and service delivery with initiatives like Justice40 and the CDC/ATSDR Social Vulnerability Index. But at the local level, many communities are left reinventing the wheel to create similar tools for neighborhood level decision-making.
The Social Equity Analysis solution delivers a set of capabilities that help you assess demographic data and community conditions, operationalize equity plans, and communicate key racial equity initiatives. The newest version of the solution, available now, added several key enhancements including incorporation of the Calculate Composite Index geoprocessing tool for index creation, the ability to perform equitable site selection, and a new ArcGIS Hub site to help engage the community.
Evaluate community conditions and outcomes
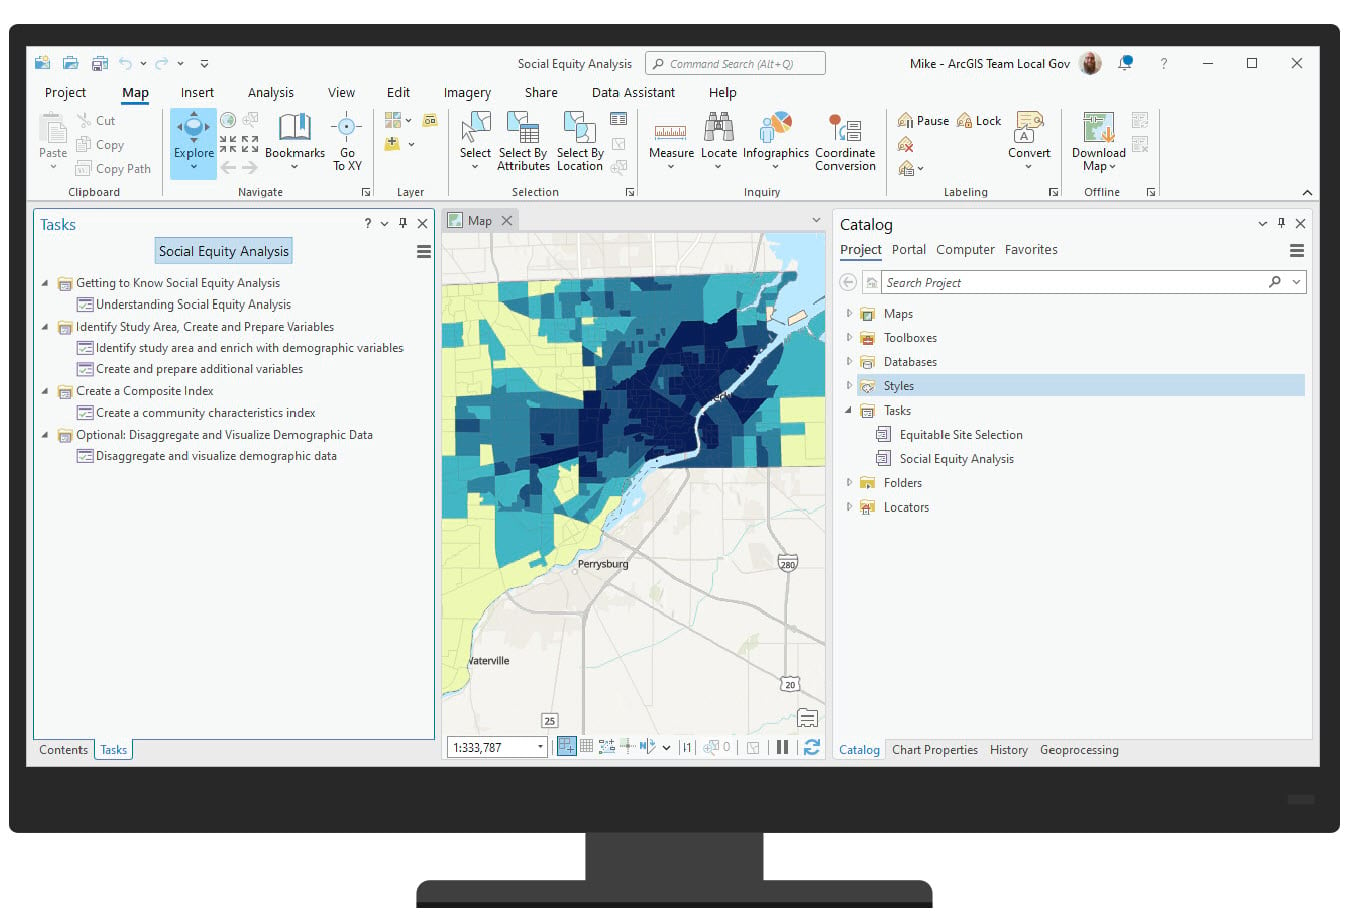
Equity offices need to understand the distribution of community conditions, assets, and outcomes. Equity analysts can map, analyze and perform exploratory analysis to identify how access and opportunity are distributed in their communities. Analyzing these patterns helps identify potential community interventions and investments and help target new or adjust existing programs when appropriate.
The Social Equity Analysis ArcGIS Pro project and tasks help equity analysts load community condition or outcome data, aggregate data into a geographic study area, create a composite index to analyze patterns, and analyze the relationship of the output indices to disaggregated racial and social demographic variables.

The resulting Community Characteristics Index allows departments to see where community conditions are high or low in relation to other identified demographic indicators. This aids in the development of interventions and actions to address inequitable community conditions, and the ability to operationalize best practices.
Perform equitable site selection
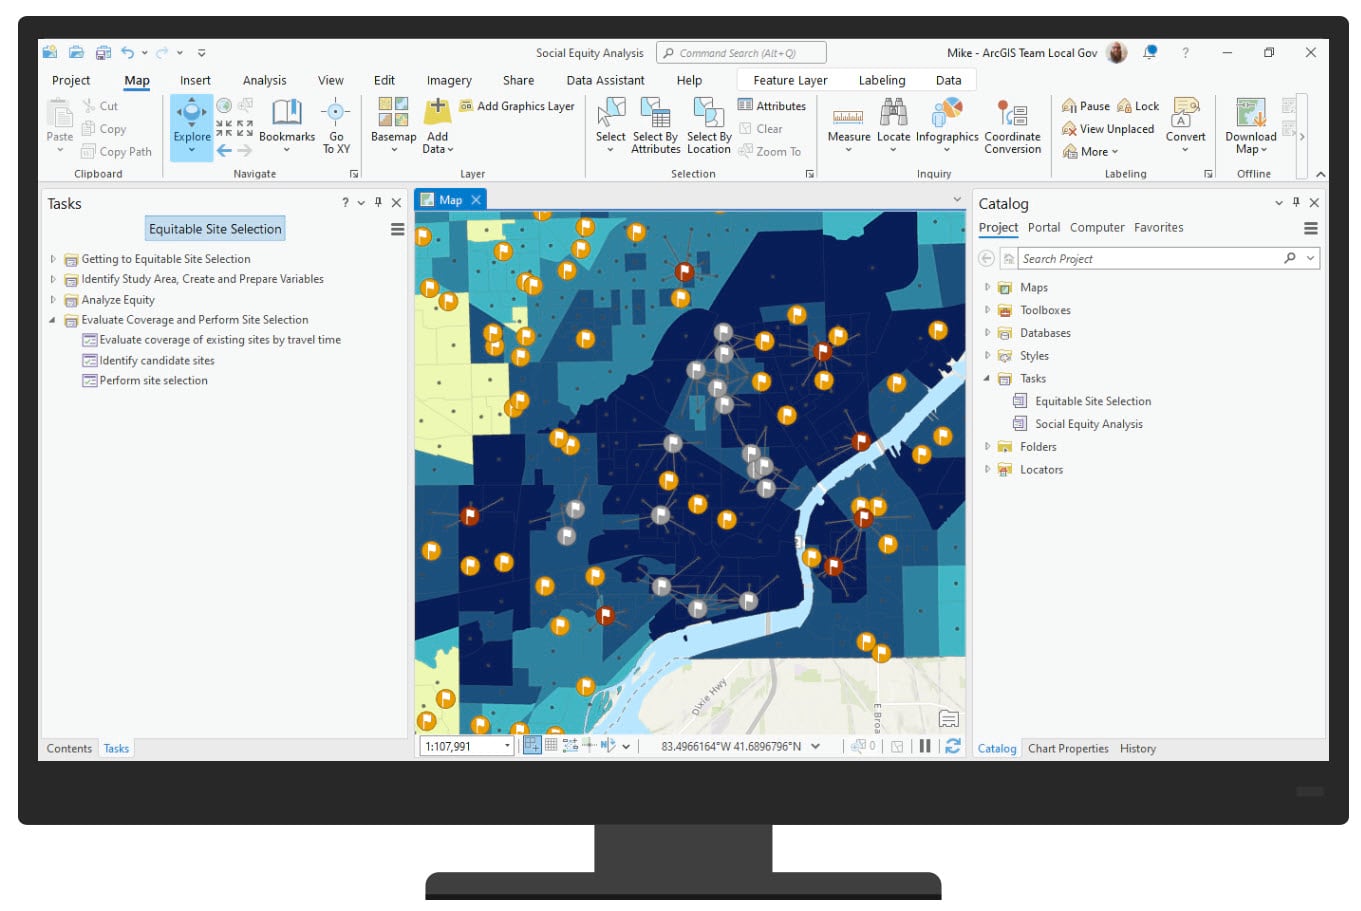
The Social Equity Analysis ArcGIS Pro project Equitable Site Selection tasks help mapping analysts aggregate data into a geographic study area to create an equity analysis index. The tasks can be used to evaluate coverage of existing sites. Or analysts can perform equitable site selection to choose the best candidate sites based on community need identified in the index.

Coverage and candidate sites are evaluated using travel mode, travel distance and/or time. For example, identifying the best facility to set up a human services office within a 15 minute walk to the study area’s most eligible residents.
Racial equity destination
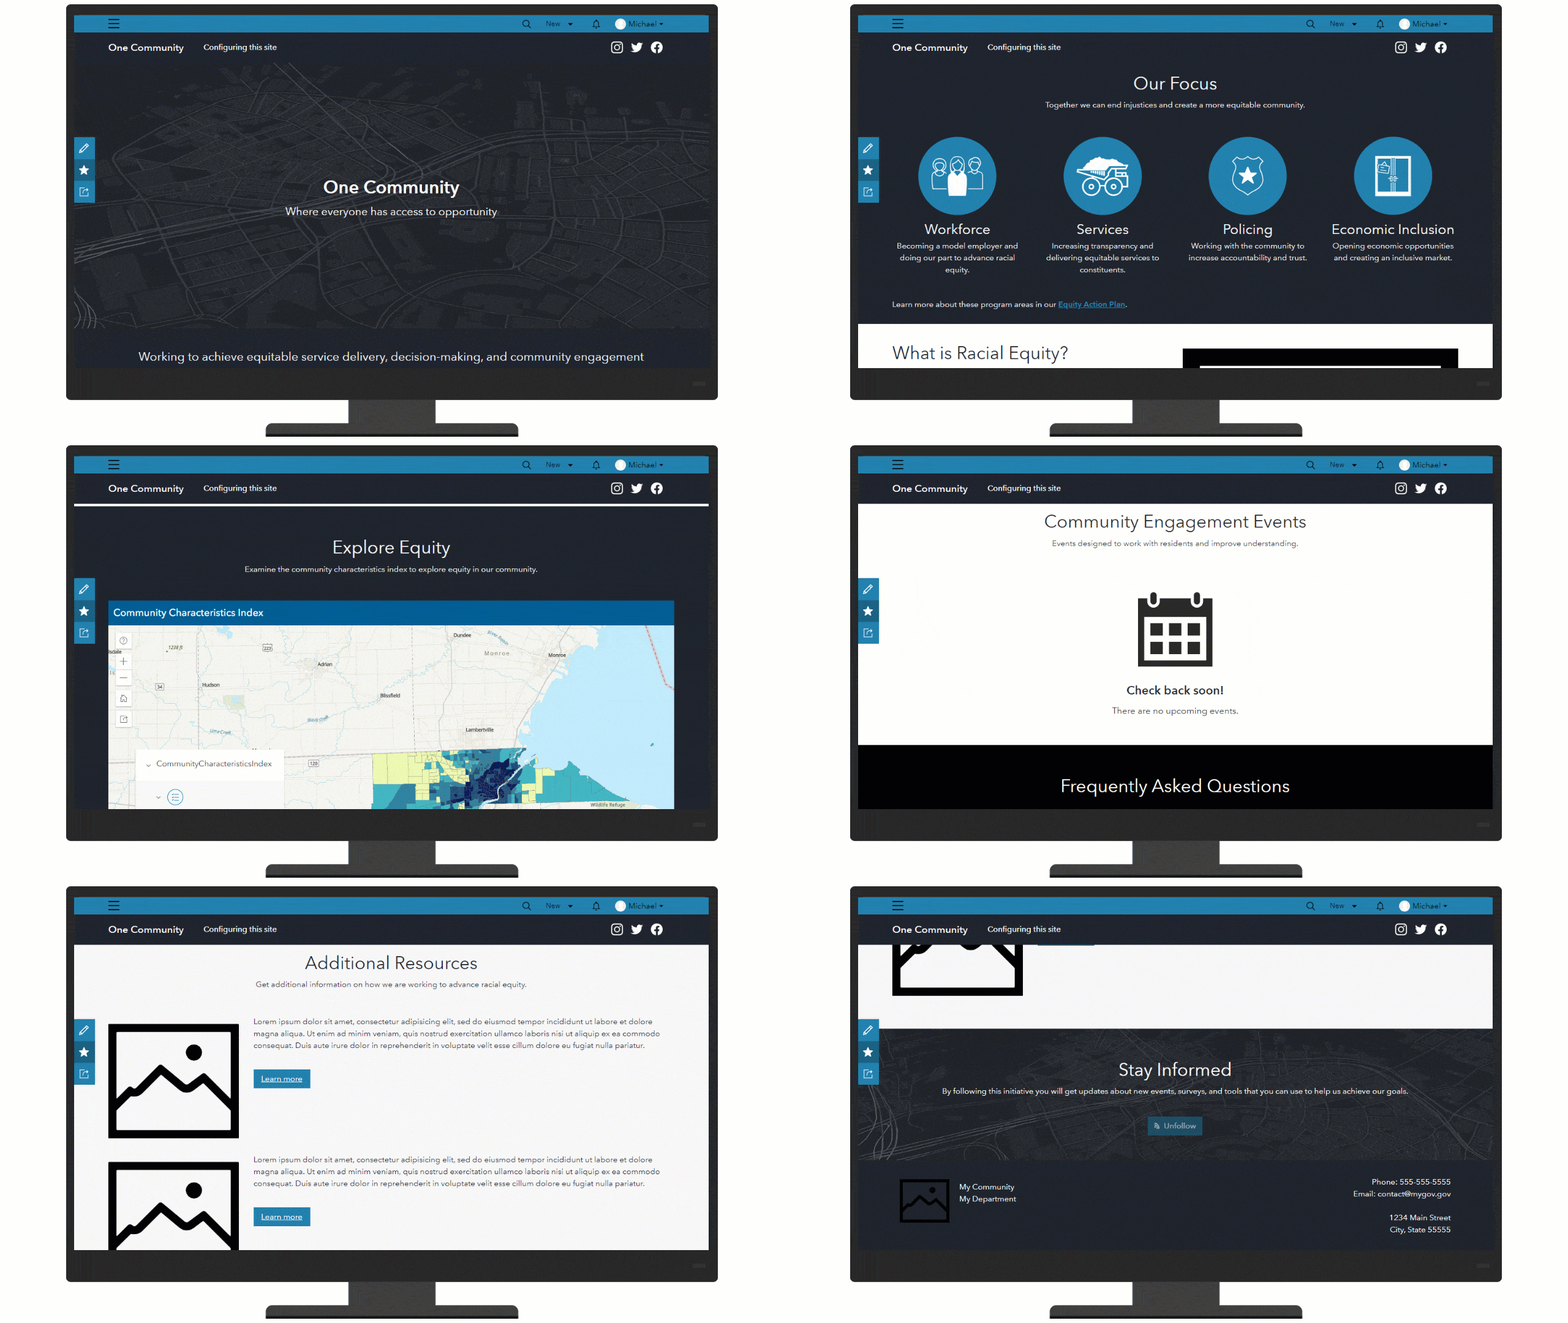
The Social Equity Analysis solution leverages an ArcGIS Hub site to promote racial equity programs. The site includes a responsive, and accessible, website that serves as a destination for key program areas (for example, Workforce, Government Services, Policing, and Economic Inclusion).

The site also includes a data portal and events calendar in order to share authoritative equity data and events with the community.
Share results and engage the community
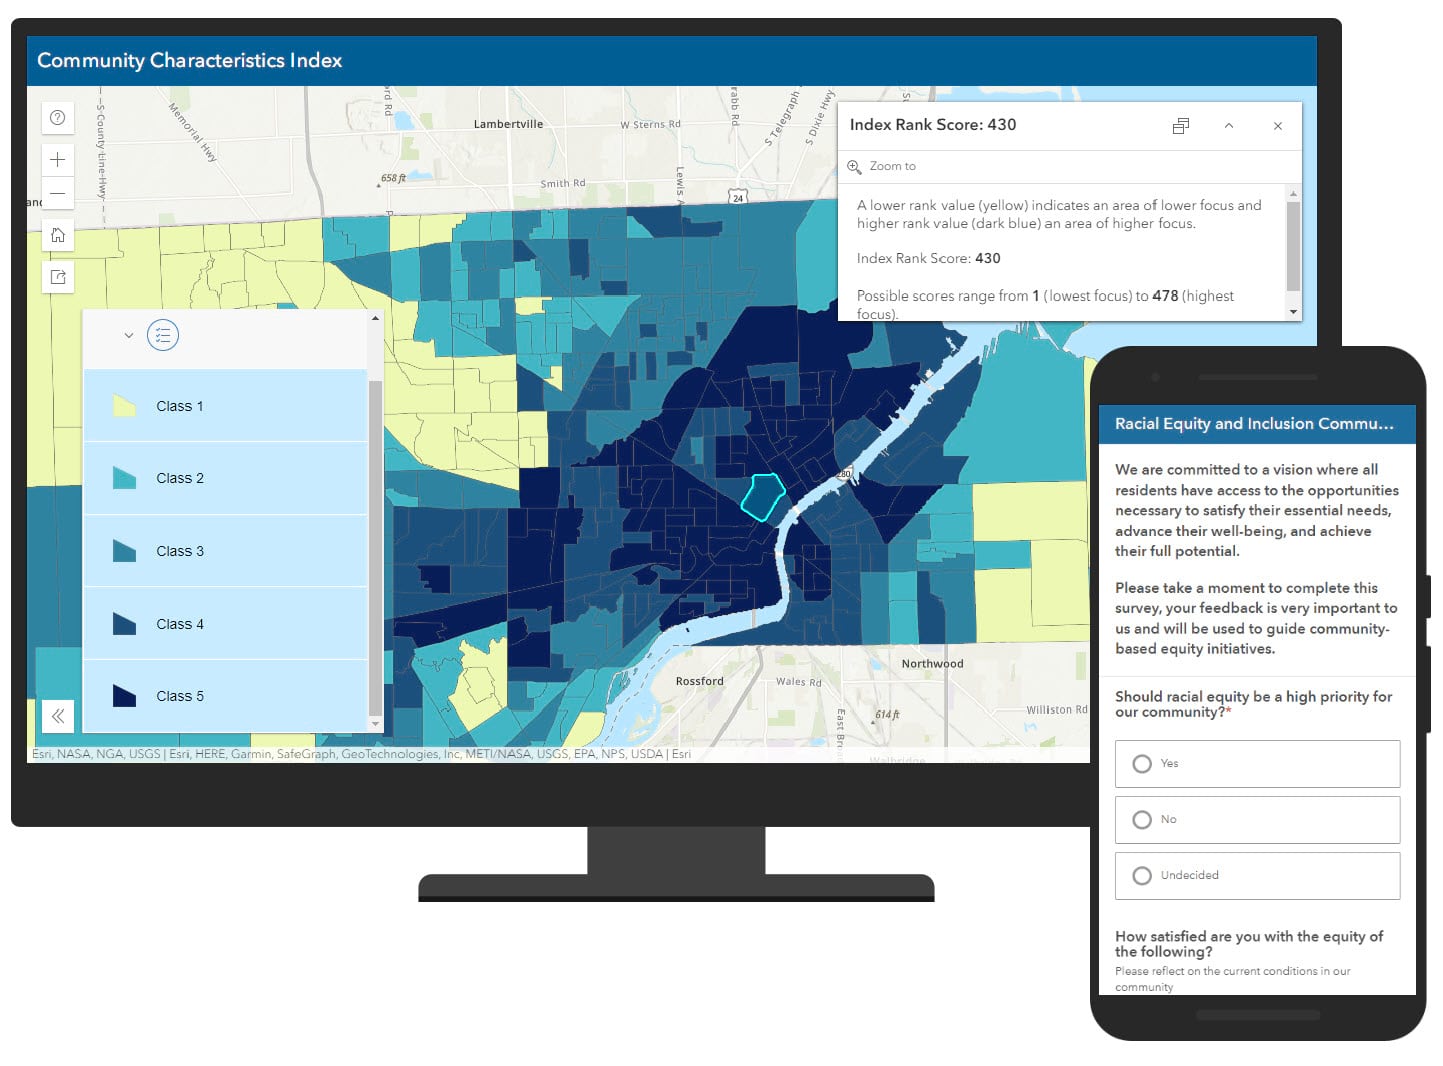
Effective communication is pivotal in the journey towards equity. The solution doesn’t just allow users to map and analyze data but also engages communities by facilitating the sharing of results. The Community Characteristics Index application is embedded in the ArcGIS Hub site so that both internal and external stakeholders can examine the output indices to understand where equitable or inequitable conditions exist.
The Racial Equity and Inclusion Community Survey can be used to gather community sentiment. Members of the public can share their thoughts about racial equity initiatives and weigh in on program priorities in their community.

Be sure to check out the latest version of Social Equity Analysis to see all the ways the solution can lend a hand.
Resources
For more information about the Social Equity Analysis solution, check out the following resources:
- Learn how deploy, configure and use to the solution.
- View a demo video.
- Chat with us on Esri Community.
- Learn more about ArcGIS Solutions.


Article Discussion: