Maps are among the most essential narrative building blocks in ArcGIS StoryMaps, but they can take a variety of forms: Static maps, web maps, web scenes, express maps, map tours, and embedded configurable apps are just some of the mapping options at your disposal. Each map type comes with its own strengths, limitations, and ideal use cases.
The map medium you choose should ultimately depend on your goals and audience. In practice, this often involves balancing competing priorities such as performance, interactivity, cartographic control, mobile usability, authoring complexity, and overall user experience.
What follows is a breakdown of the primary map types available in ArcGIS StoryMaps, along with some guidance for determining which option is best suited to your narrative. If you’re looking for a quick reference, jump ahead to the comparison table at the end of this post.
- Static maps
- Web maps
- Web scenes
- Express maps
- Map tours
- Configurable apps
- Bonus: Static maps as web map media layers
- Comparison table
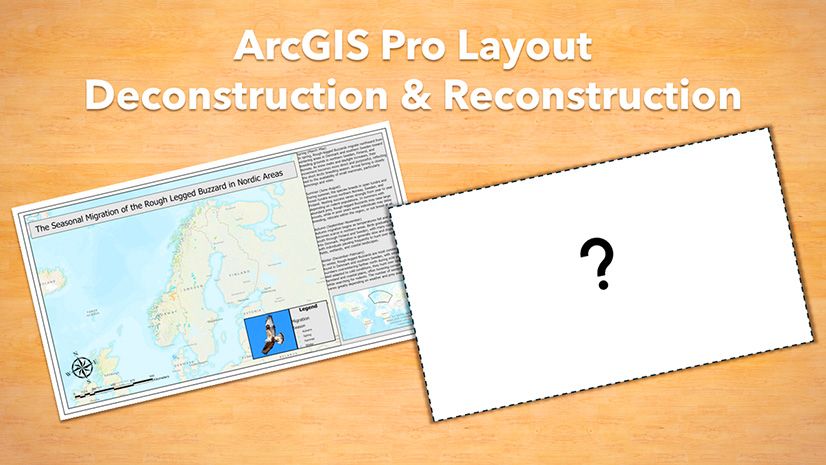
Static maps
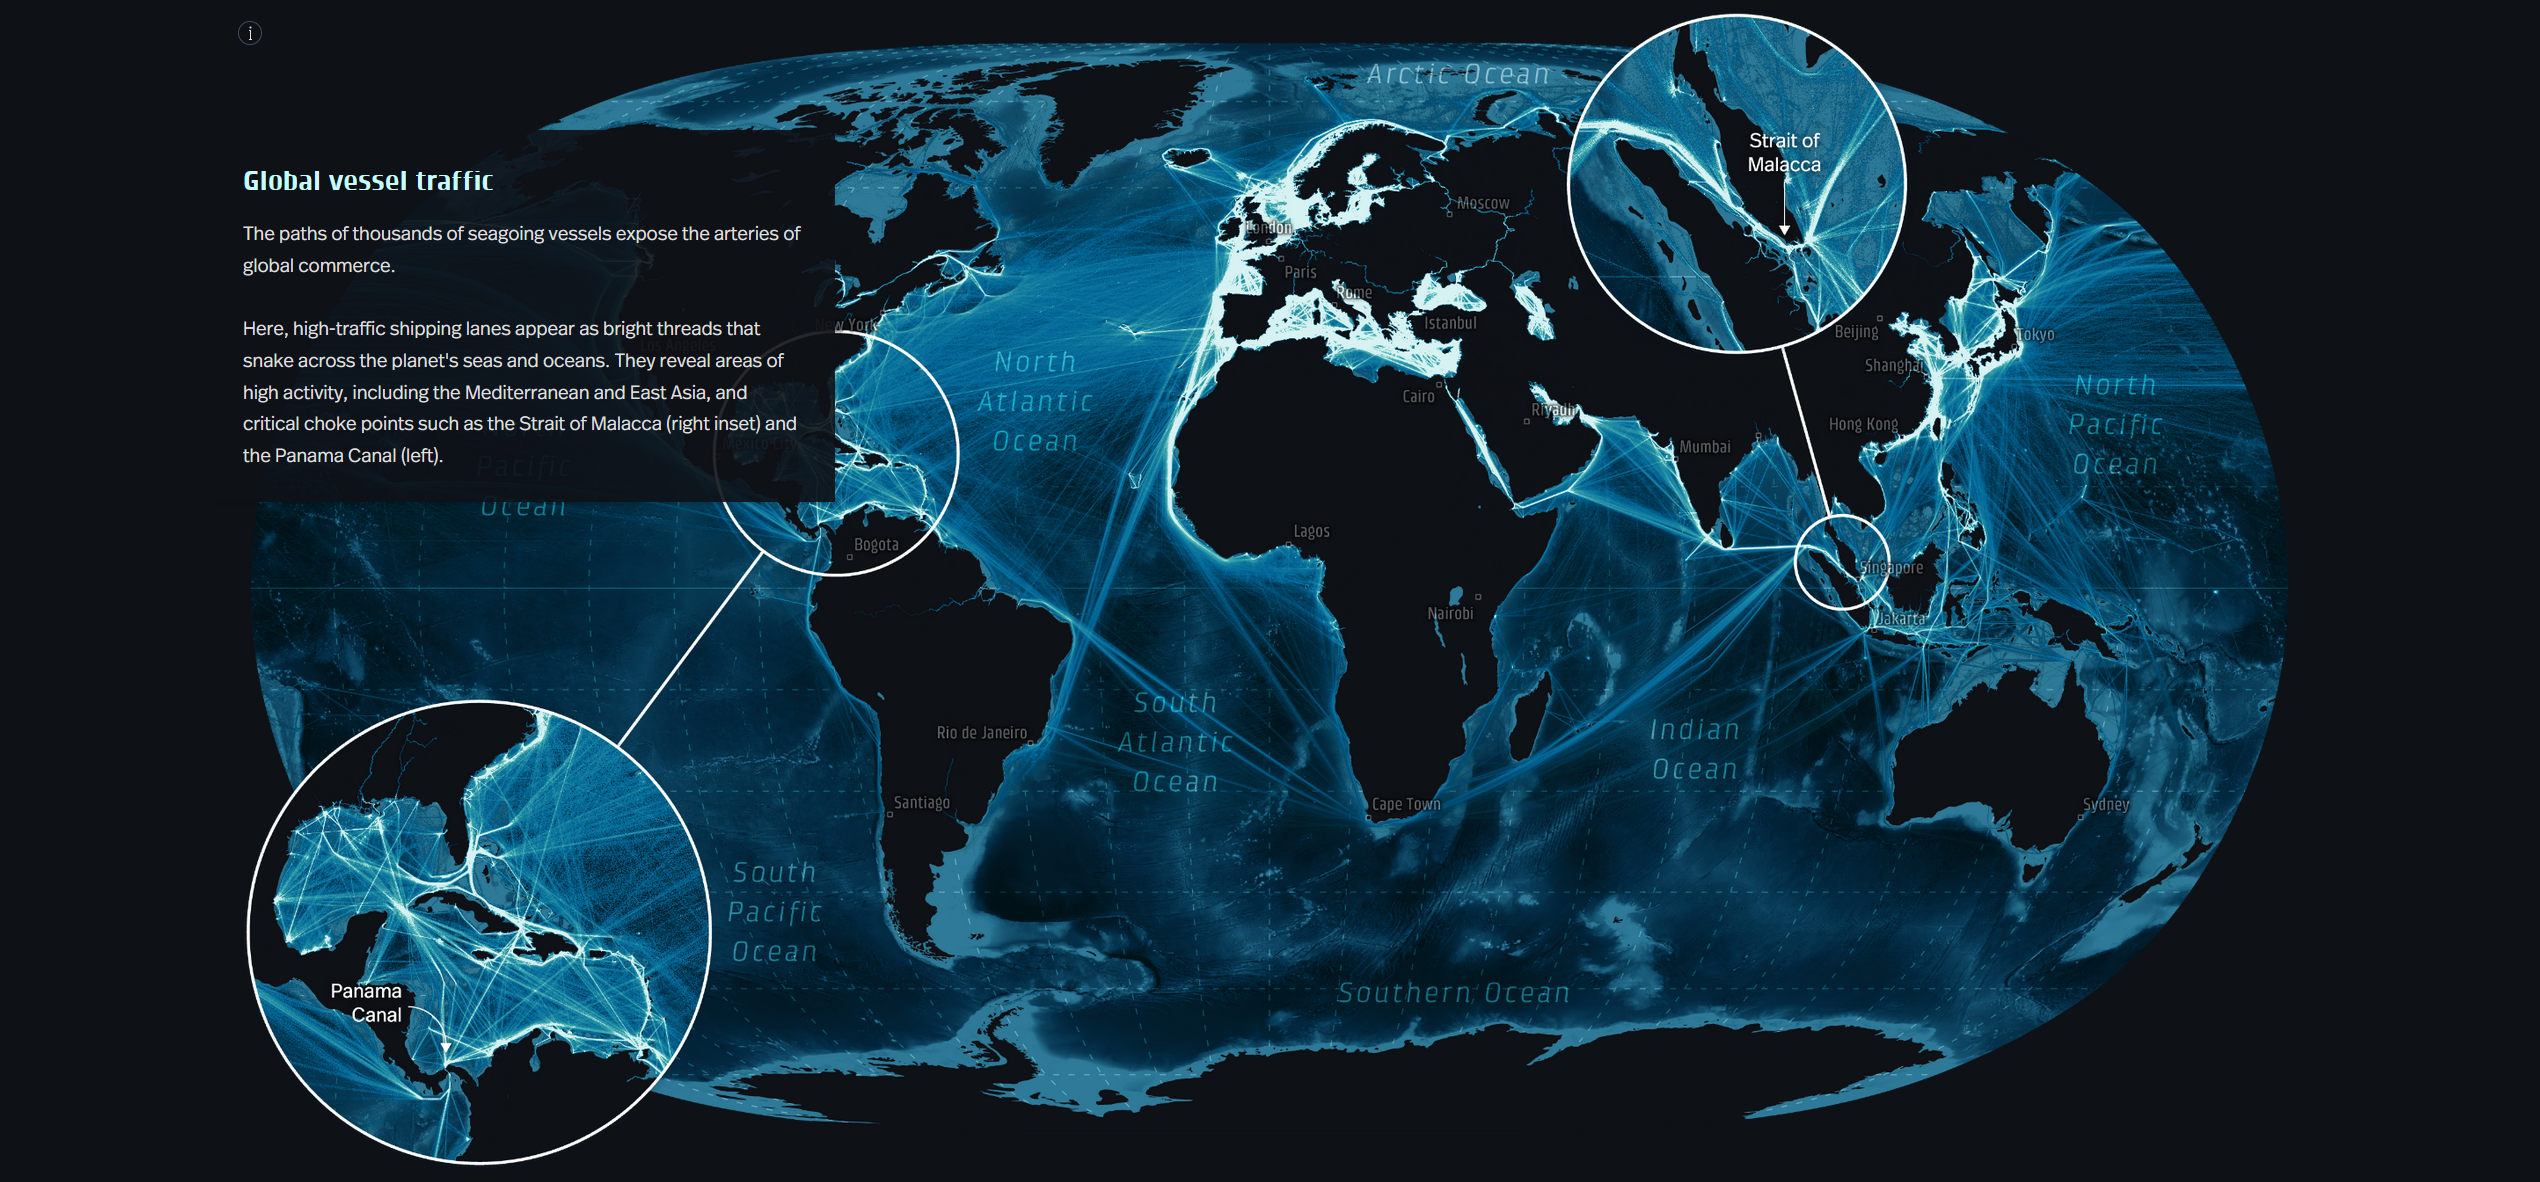
Static maps — whether authored in ArcGIS Pro, ArcGIS Maps for Adobe Creative Cloud, or captured as screenshots — are added to stories as images. They remain one of the most powerful options for narrative cartography because they provide complete control over a map’s appearance. If your story relies on an unusual projection, highly customized symbology, extensive annotation, or a carefully crafted visual design, a static map is often the best choice. They also make it possible to create layouts that would be difficult or impossible with interactive maps, such as tall scrolling maps or maps that blend seamlessly into surrounding story content.
The tradeoff is that readers cannot interact with a static map: There are no navigation tools or pop-ups to reward readers’ curiosity. While this technical constraint limits exploration, it can also be an advantage: Without interactive distractions, readers remain focused on the message you want to communicate.
Static maps are also highly performant across devices and in low-bandwidth environments, though authors should pay special attention to text and annotation, which may become difficult to read on smaller screens.
Learn fundamental design principles for cartography →
Discover best practices for creating static map layouts in ArcGIS Pro →
Web maps
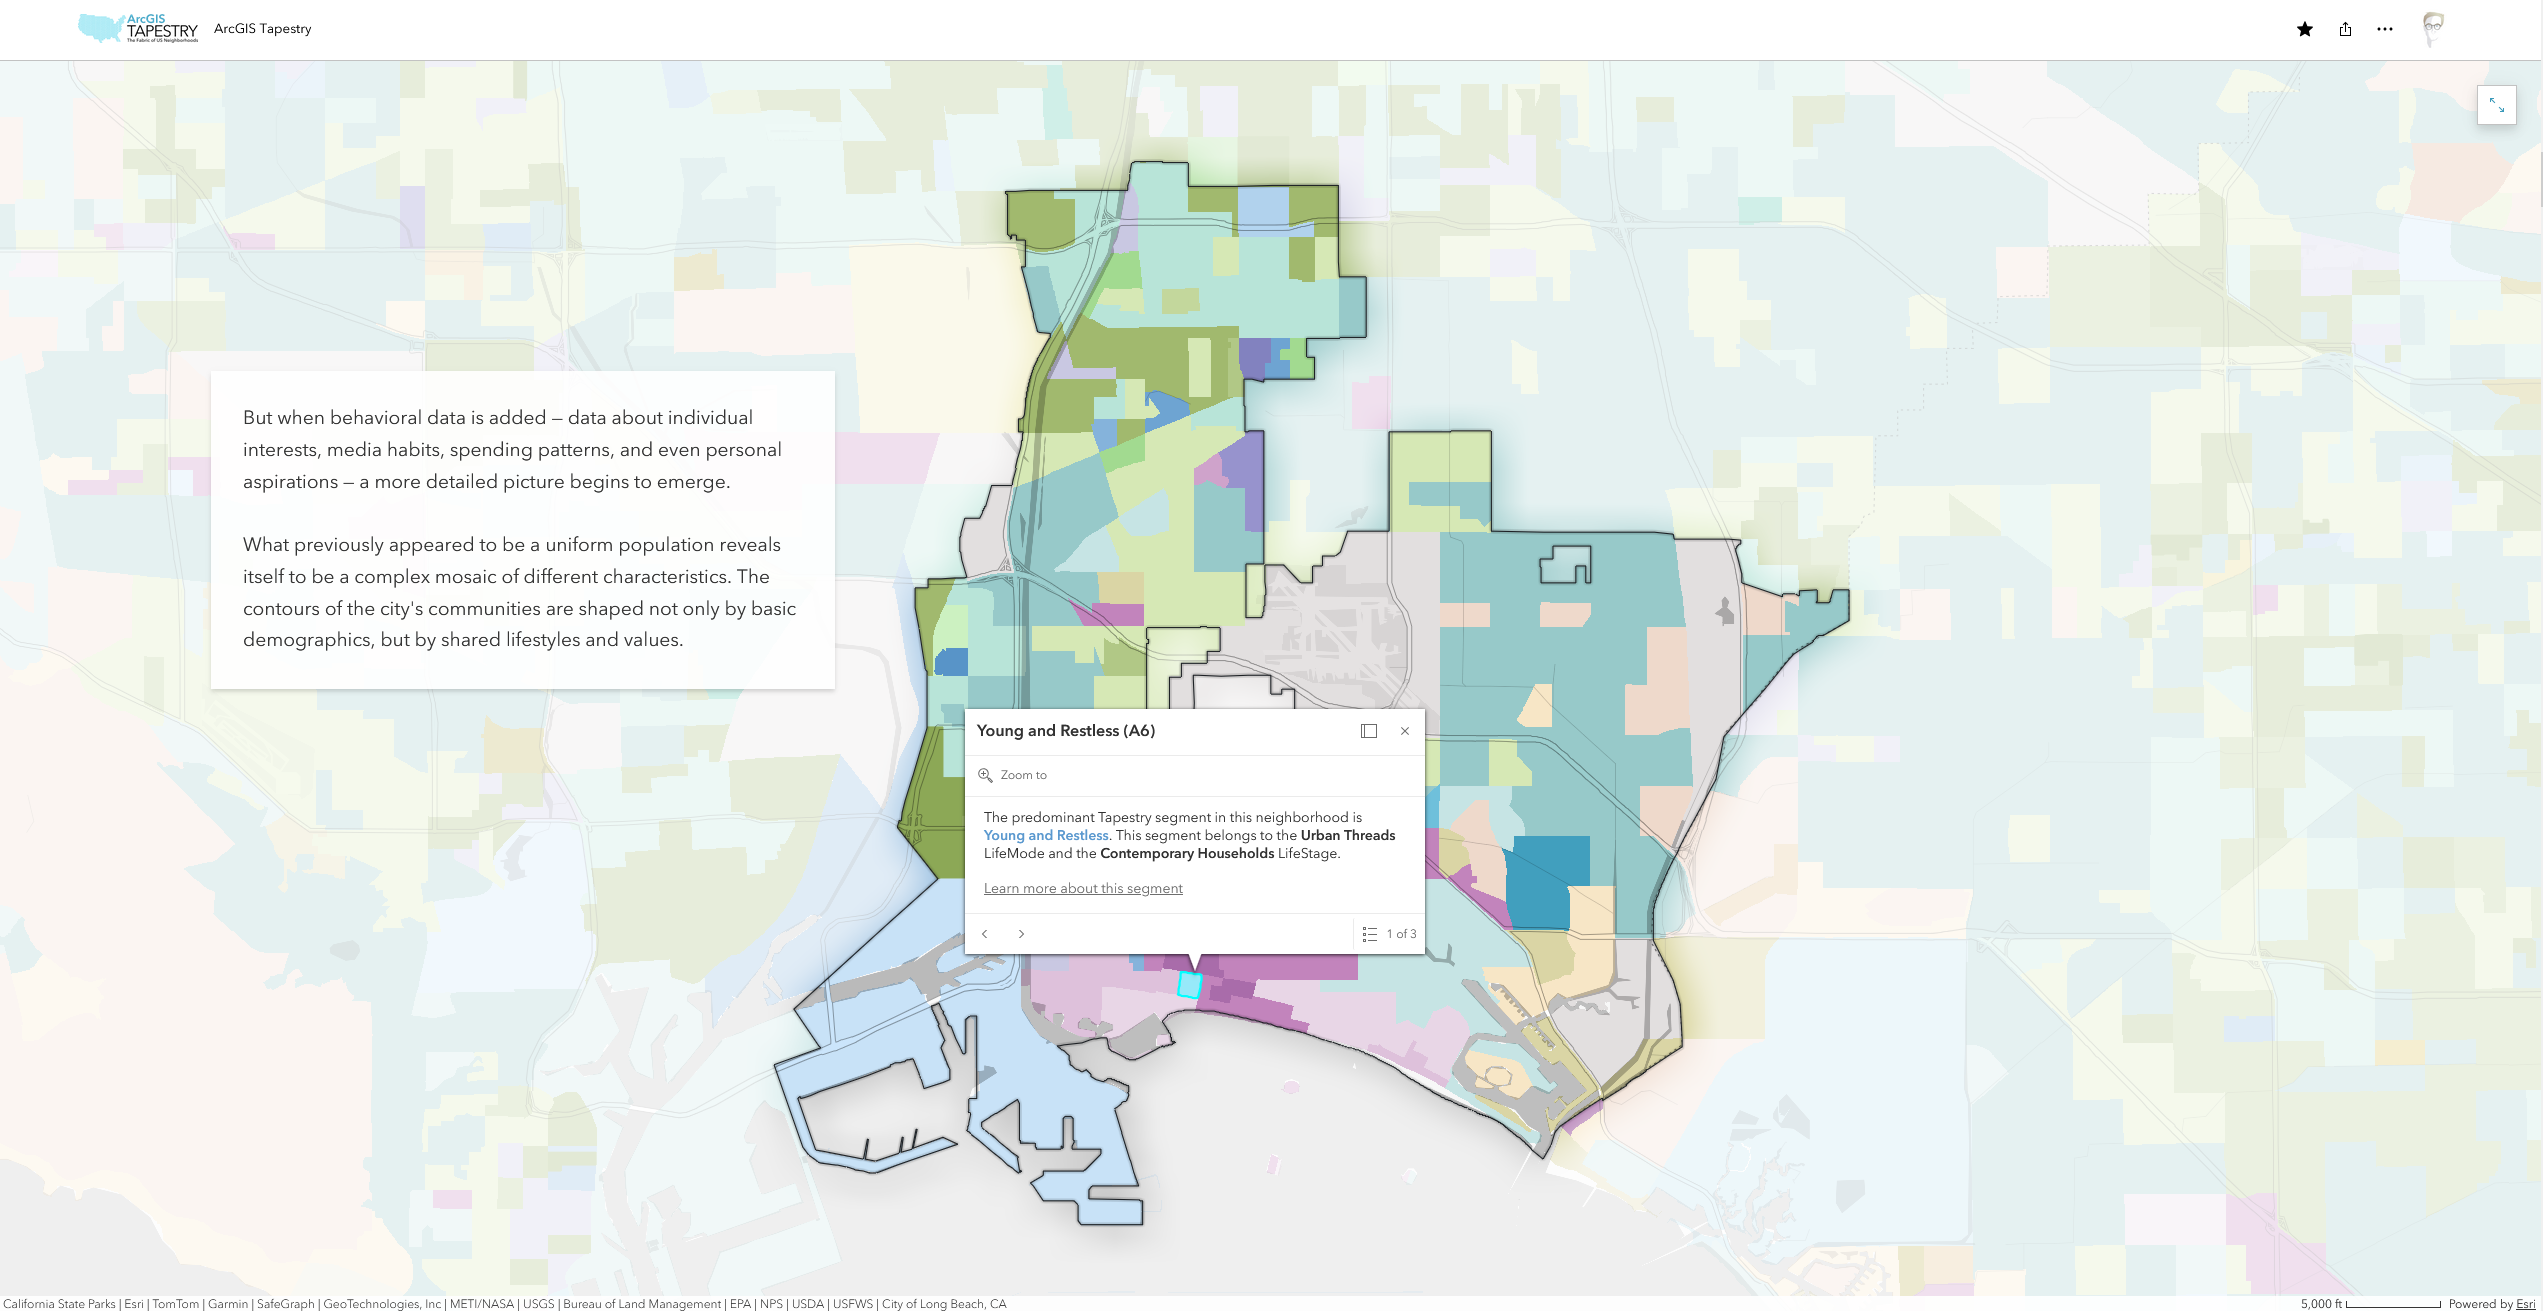
Web maps are the most flexible map type at your disposal in ArcGIS StoryMaps. Authored in ArcGIS Map Viewer and added directly to stories via the map block, they support a wide range of layer types and interactive capabilities, while also integrating seamlessly with StoryMaps features such as map choreography. Web maps are particularly effective when readers benefit from exploring geography or data themselves, whether by navigating around the map, examining features and their pop-ups, or comparing multiple layers of information.
Because web maps support rich interactivity, they are often the best choice for immersive storytelling experiences. Web maps can combine points, lines, polygons, imagery, labels, media layers, and more within a single map, making them well suited for complex geographic narratives. They also benefit from their close integration with ArcGIS Online; it’s easy to reuse and adapt maps created elsewhere in your organization, or accessed via Esri’s Living Atlas of the World.
However, the flexibility that web maps offer also comes with greater responsibility as an author. Maps containing many layers or large datasets can become difficult to navigate, and may perform poorly on smaller devices. Thoughtful, intentional decisions around map contents — a central tenet of effective geographic storytelling — will help ensure the experience remains focused and responsive for all readers.
Web scenes
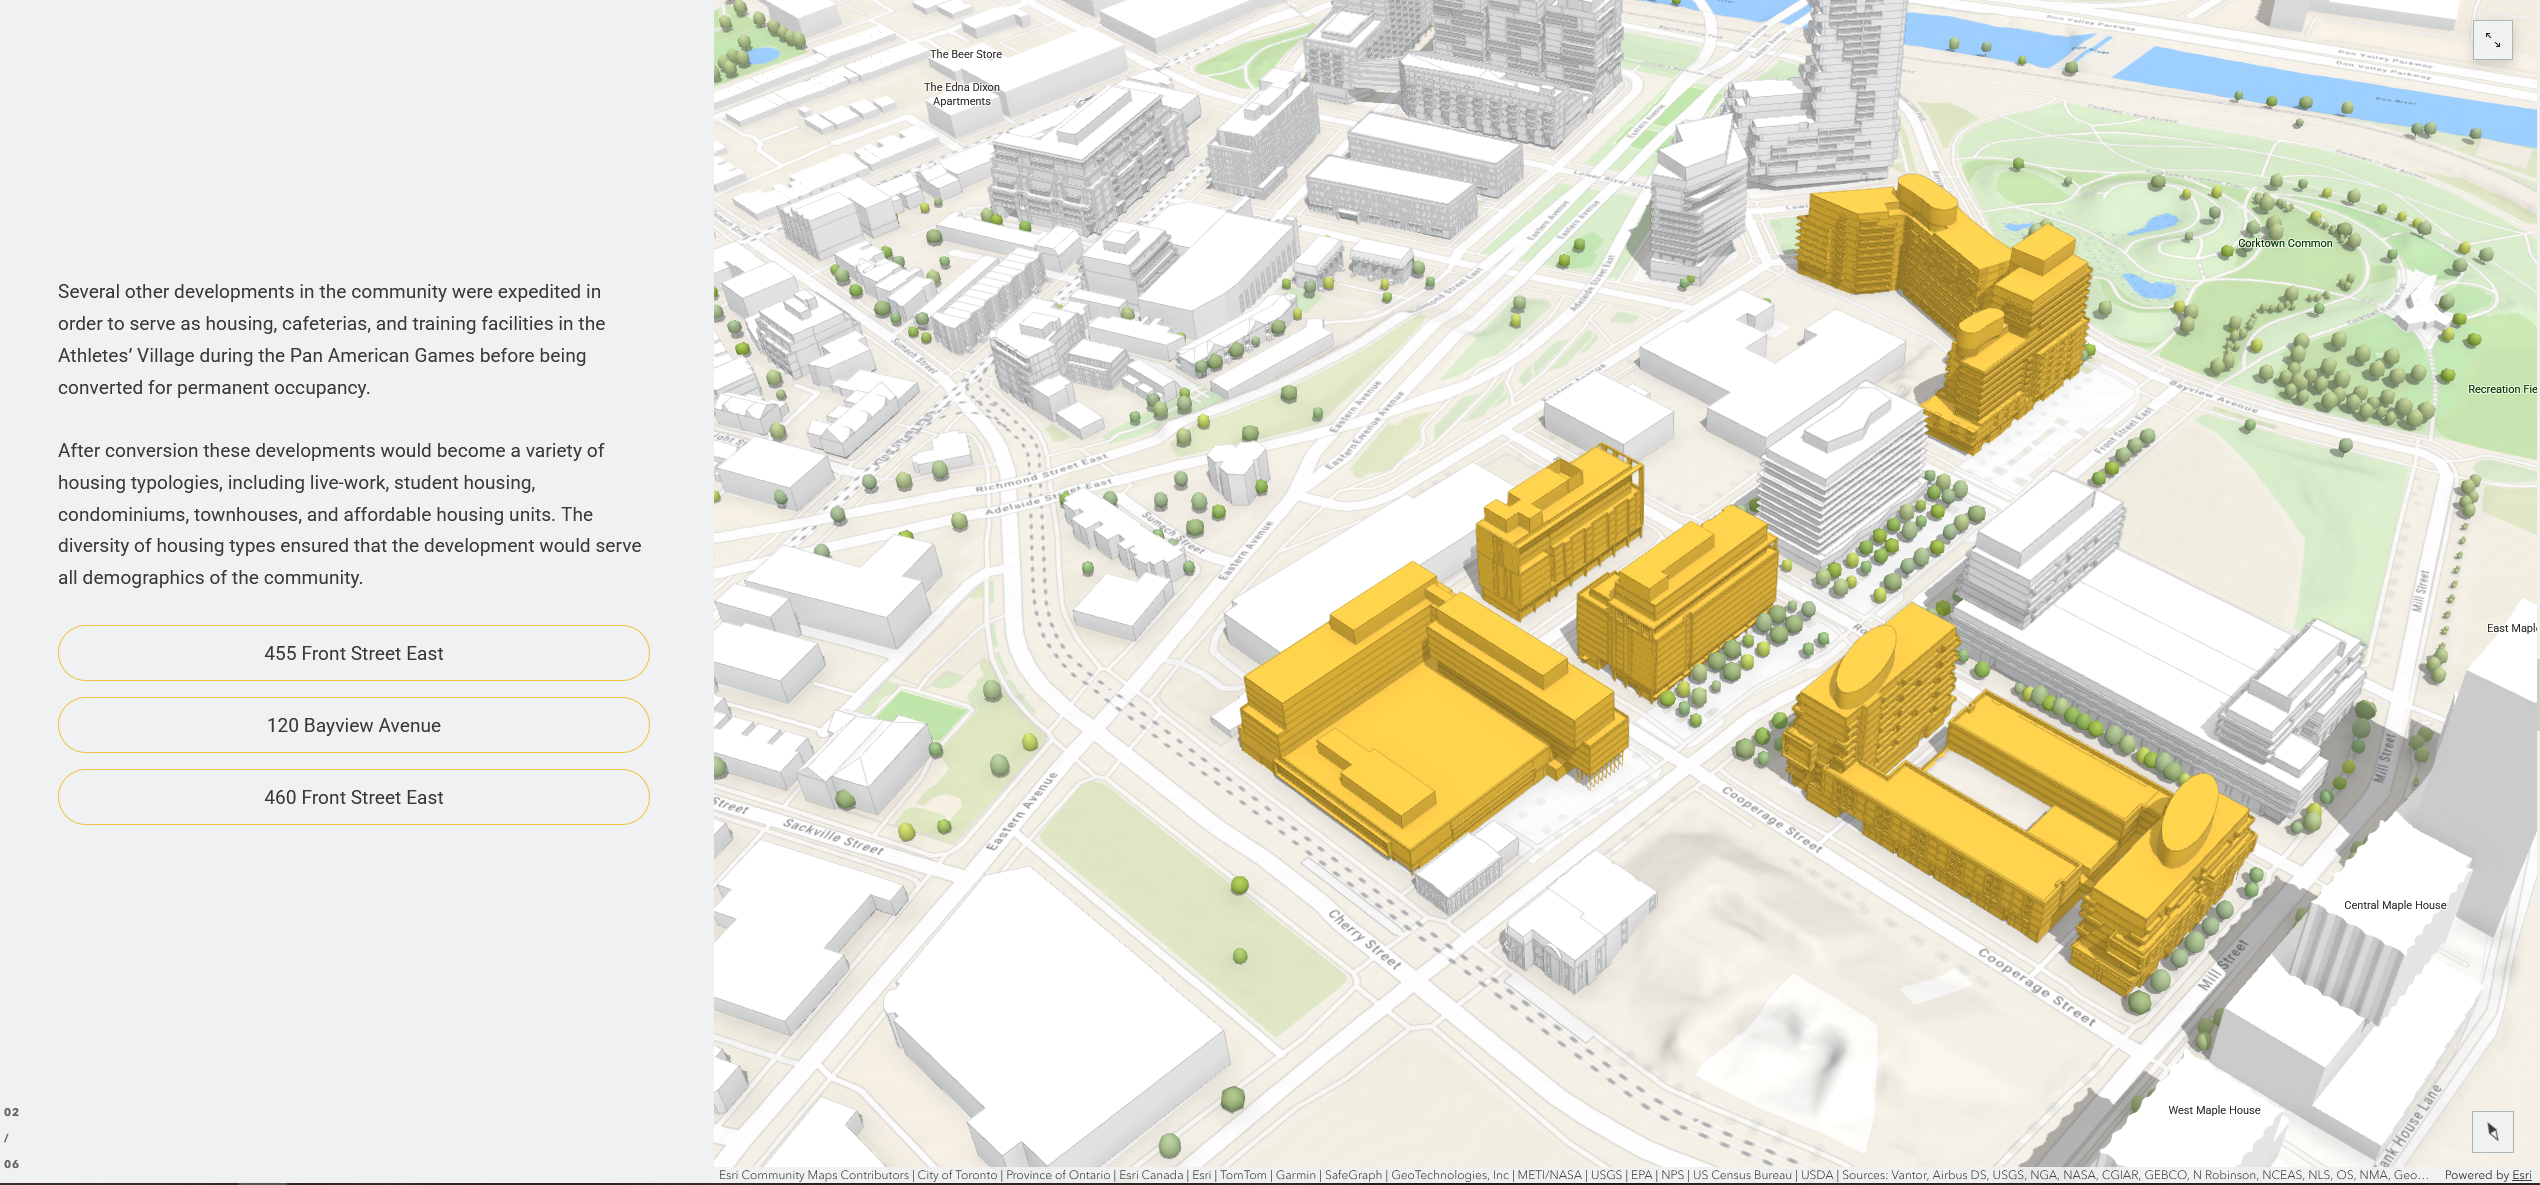
For most stories, two-dimensional maps are sufficient. But when the third dimension is essential to understanding a story, web scenes provide capabilities that other map types cannot. Authored in ArcGIS Scene Viewer, web scenes add depth and spatial realism to your maps, making them especially valuable for stories where terrain, elevation, or the built environment play a central role. Web scenes also support 3D models and volumetric visualizations, unlocking creative opportunities for architectural, infrastructure, and urban storytelling.
Compared to static maps and web maps, web scenes offer fewer cartographic design options and place greater demands on both authors and readers, particularly on mobile devices and lower-powered hardware. Complex web scenes can suffer from poor performance in low-bandwidth environments, and navigation controls can be difficult to manipulate on small screens. As a general rule, web scenes are most effective when 3D contributes directly to the narrative, rather than a visual novelty.
Learn when to use a 3D web scene →
Explore tips and best practices for storytelling with 3D models →
Express maps
Express maps are lightweight reference maps created directly within the StoryMaps builder. Their strength lies in simplicity: express maps provide enough functionality to orient readers geographically, but don’t require extensive setup or cartographic expertise to author. And unlike web maps or web scenes, express maps do not exist as standalone items in ArcGIS Online, which significantly reduces content management overhead and makes them one of the fastest mapping options to author.
Because express maps prioritize speed and ease of use over flexibility, they are best suited for simple reference maps, locator maps, geographic tables of contents, or stories that only need to highlight a handful of places. They integrate seamlessly with a story’s theme and perform well across devices. Authors looking to create thematic maps, support complex datasets, or incorporate advanced cartographic techniques will generally find web maps or static maps better suited to the task — but express maps fulfill a lightweight mapping need better than these other map types.
Learn when to use an express map →
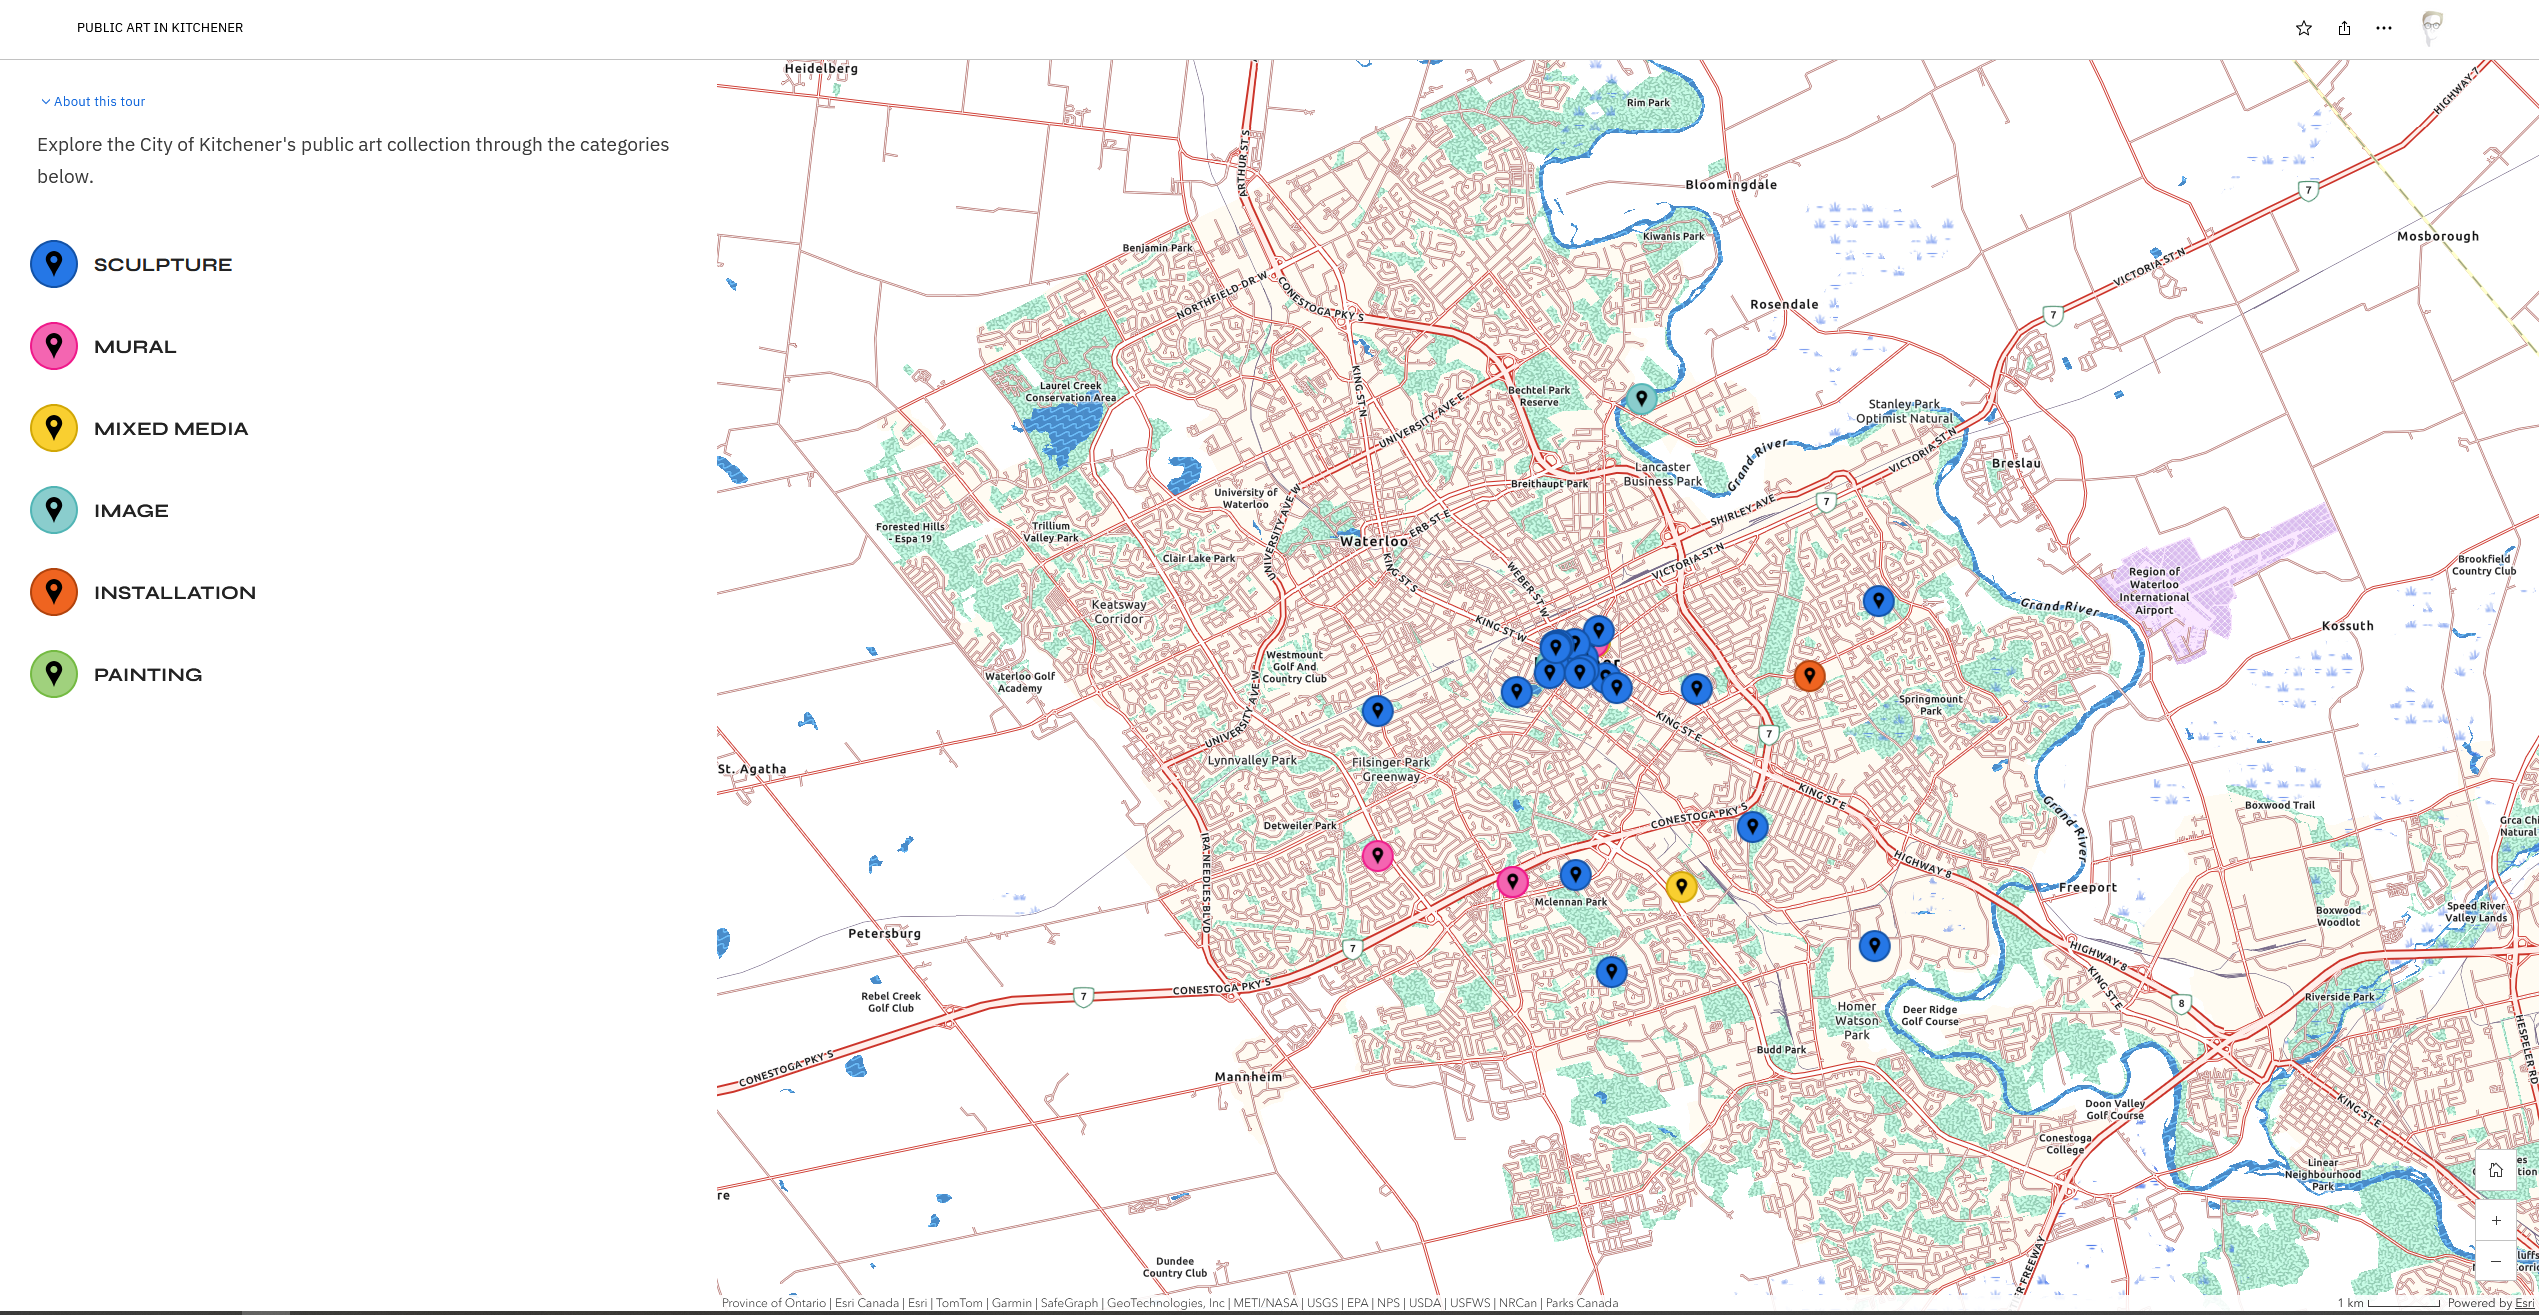
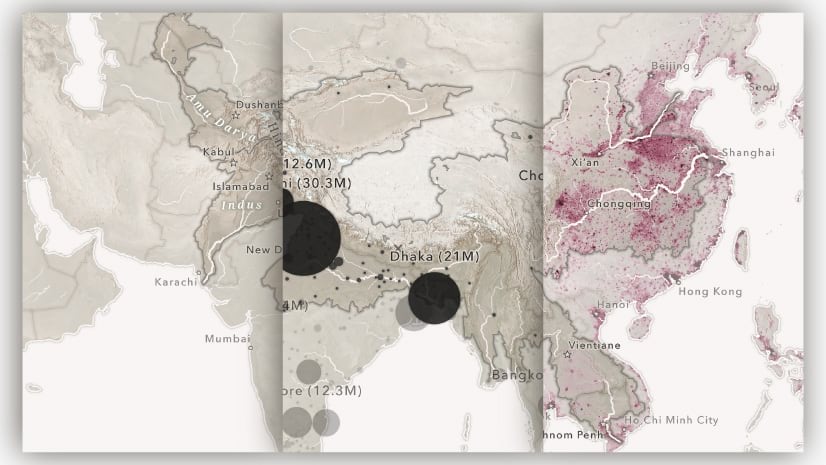
Map tours
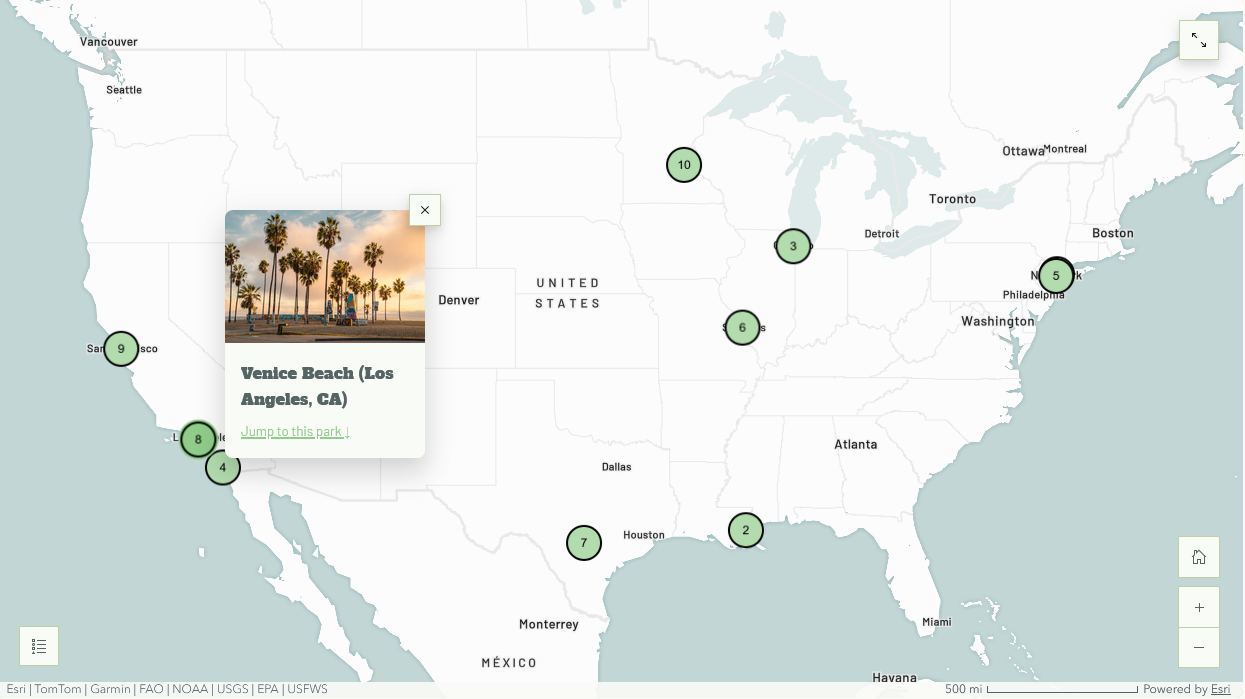
Map tours are purpose-built storytelling blocks, authored directly in ArcGIS StoryMaps, that are designed to present collections of related places. Map tours come in several layouts, each optimized to serve a different narrative purpose: guided tours are ideal for presenting a sequential group of places; explorer tours encourage self-directed browsing; and categorized tours allow authors to group places by common themes.
Regardless of layout, map tours combine maps and media into a cohesive experience that is optimized for both desktop and mobile devices. Because their user experiences are largely predefined, map tours are among the easiest storytelling maps to author. They’re well-suited for a variety of use cases, including travel stories, architecture guides, campus tours, historical site collections, and other narratives centered on a series of locations. While map tours can be authored place-by-place, they also support data-driven workflows, and work well with larger point-based datasets that share a consistent structure.
The primary tradeoff, once again, is flexibility: map tours offer fewer cartographic customization options than static maps or web maps and provide less control over the reader experience than a carefully choreographed web map sequence.
Learn how to create a data-driven map tour →
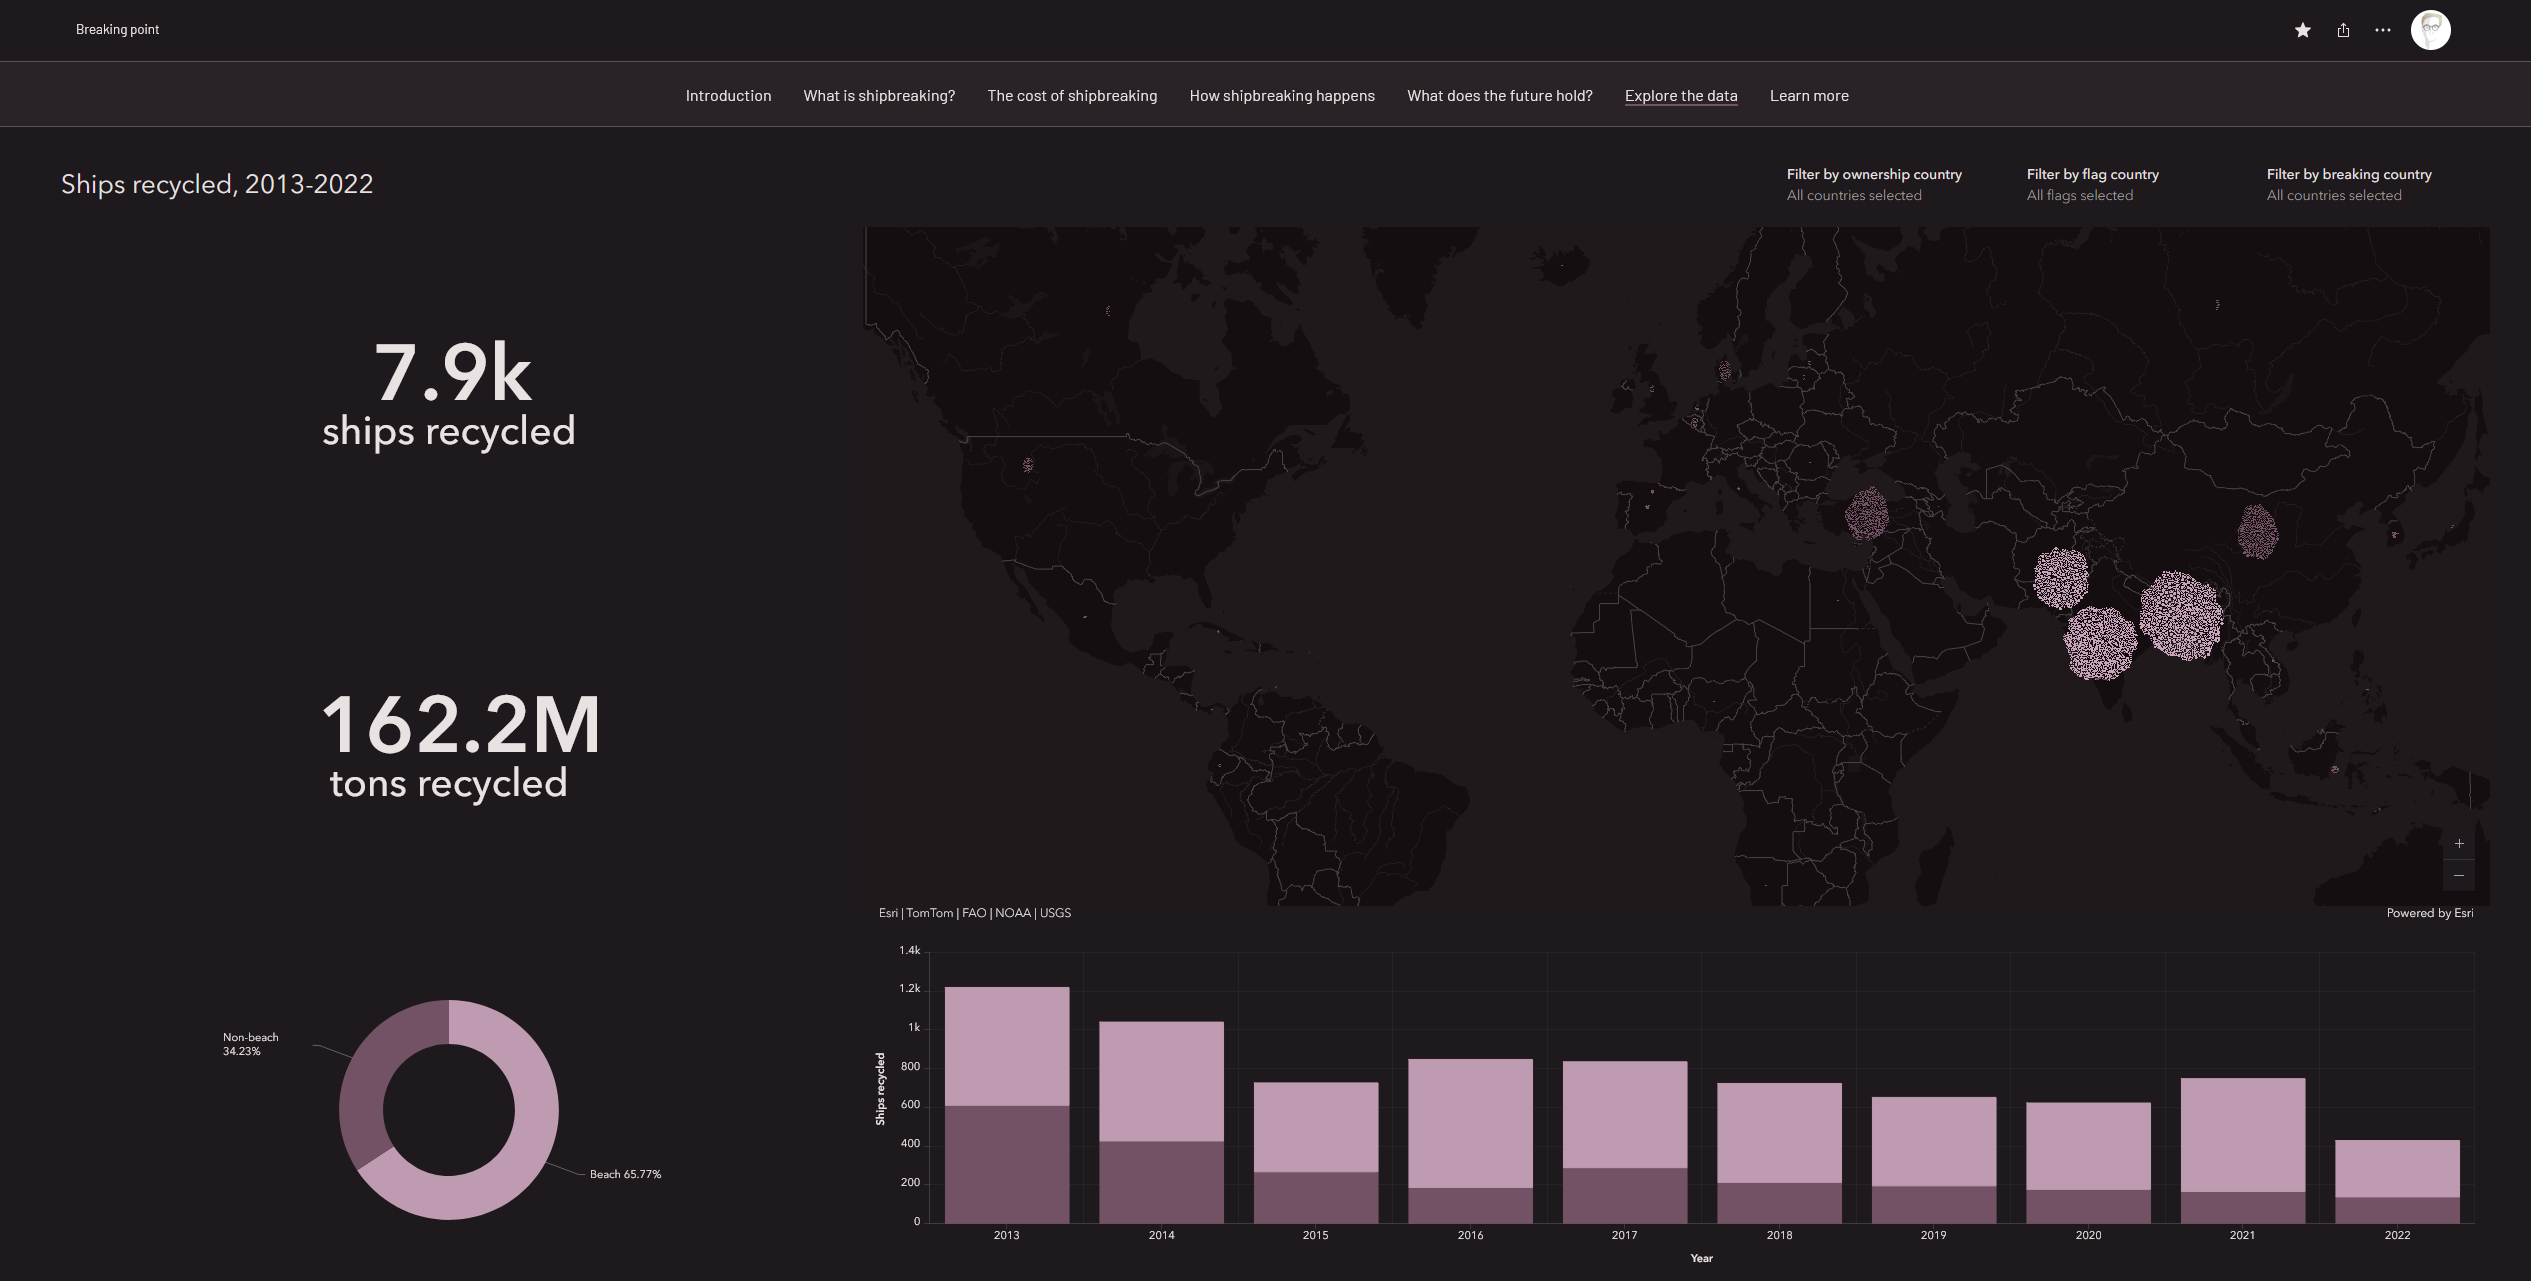
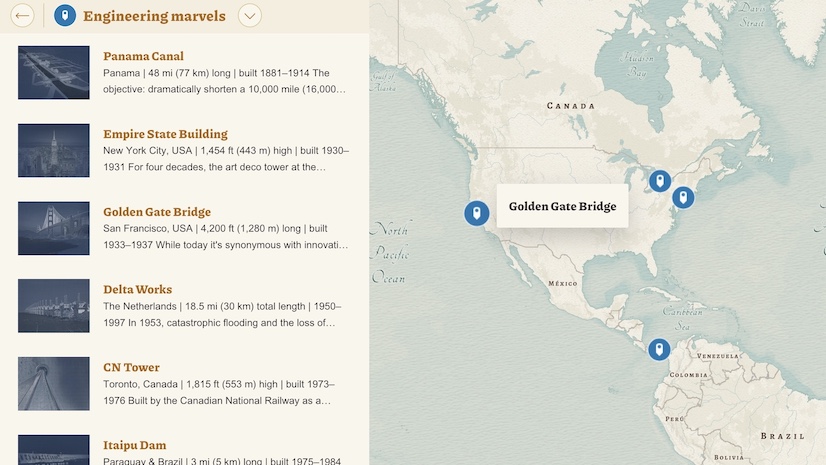
Configurable apps
Configurable apps — including dashboards, instant apps, and other ArcGIS applications — can be embedded in stories using the ArcGIS app block. Configurable apps are often designed to support exploration, combining interactive maps with charts, tables, indicators, filters, and other elements, allowing readers to investigate data and answer their own questions.
Configurable applications are particularly useful when exploration is the primary goal. Because configurable apps are embedded experiences, however, they do not integrate as seamlessly with ArcGIS StoryMaps features as native maps do. Their complexity can also present legibility and usability challenges on smaller devices — especially if the author hasn’t configured a dedicated mobile layout. Configurable apps may overwhelm readers if they’re presented without sufficient context, or used in lieu of a simpler map.
Learn about bringing configurable apps into ArcGIS StoryMaps →
Discover best practices for dashboard design →
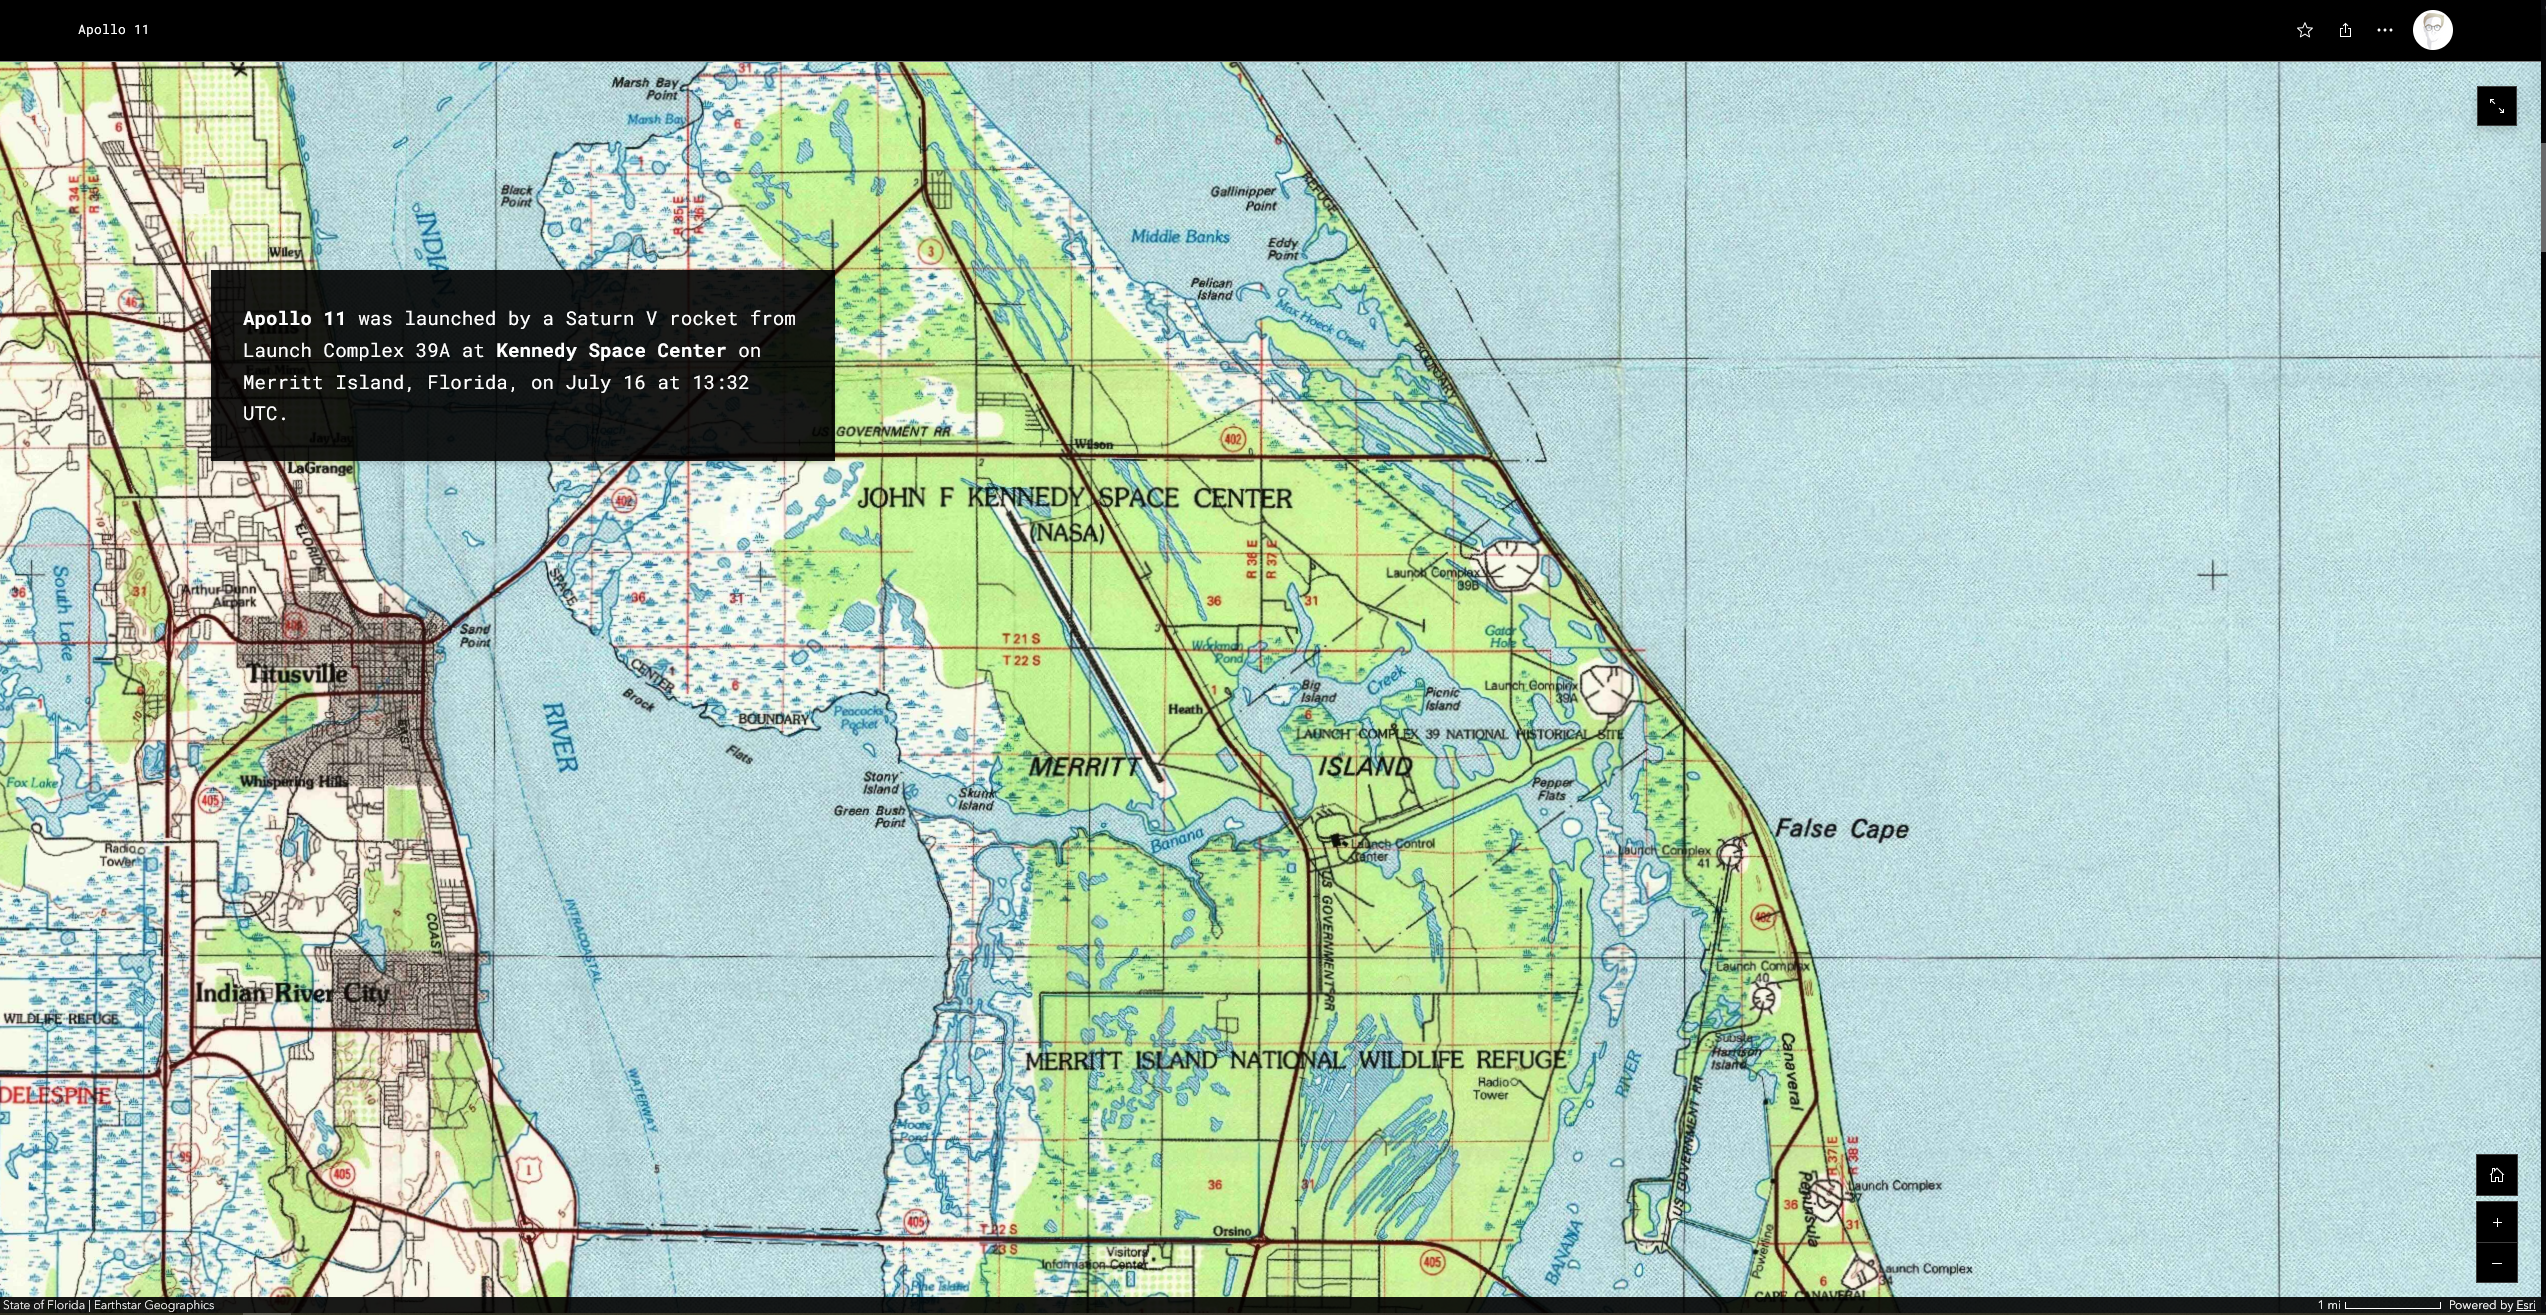
Bonus: Static maps as interactive layers
While static maps and interactive maps are typically presented as distinct choices, it’s possible to combine elements of both to create unique narrative experiences. By adding a static map as a media layer within a web map, or by using a static map as the basemap in an express map, authors can preserve the cartographic control and visual design of a custom map, while also introducing limited interactivity.
This hybrid approach works well for displaying historical maps alongside contemporary map data — or for enhancing a custom map with limited interaction and annotation. A custom thematic map, for example, can be combined with sketch layers, labels, annotations, or other Map Viewer/express map capabilities to help readers focus on specific areas of interest. While this workflow is typically more complex than using either map type on its own, it can offer discerning story authors an appealing middle ground between fully static and fully interactive experiences.
Learn to use historical maps as media layers →
Choosing the right map type
No single map type is best for every story. Instead, the most effective choice depends on the goals of the narrative and the needs of the audience. As you evaluate your options, consider a few key questions:
- Does the map require advanced cartography — such as unconventional projections, custom symbology, or extensive annotations — to communicate effectively?
- Does the audience need to explore the geography or data?
- How important is the mobile experience for your audience?
- Is terrain, elevation, or 3D visualization central to the story?
- Is the experience primarily guided or exploratory?
- How much authoring complexity is appropriate for the project?
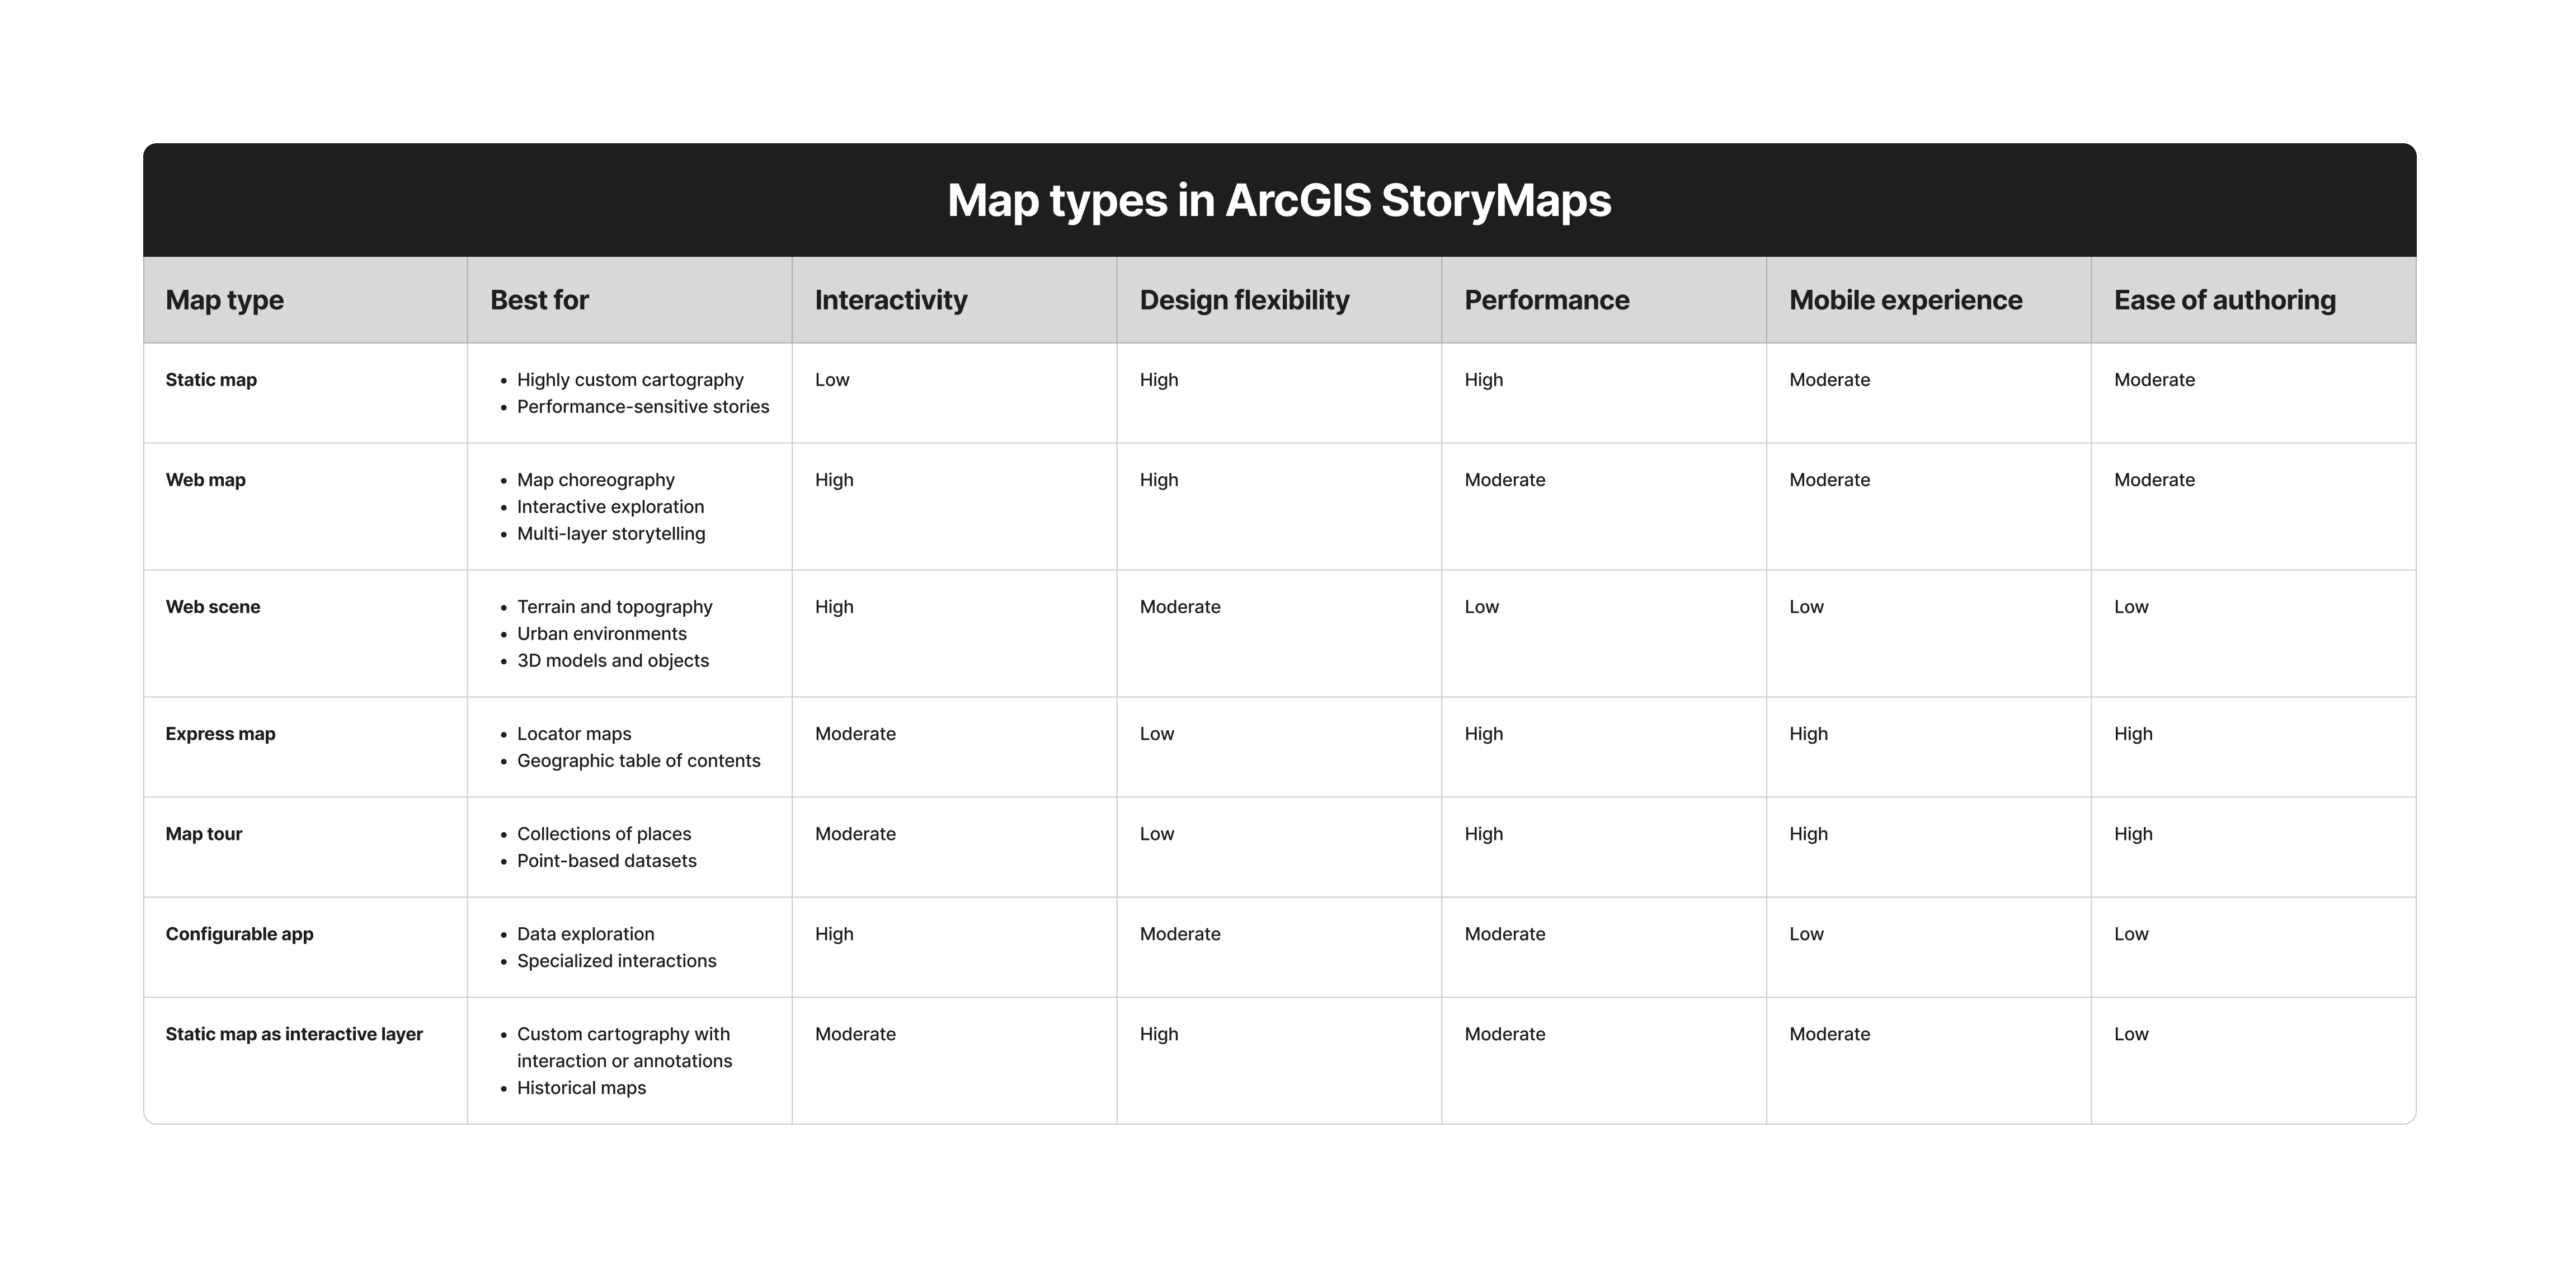
The answers to these questions will often point naturally toward one or two map types while ruling out others. The reference table below can also help you make an informed decision. Download a larger version of the table.
Thoughtful, intentional map selection is a critical consideration for all geographic stories. Using an appropriate map medium significantly improves clarity, usability, and narrative impact, while using the wrong medium can completely nullify your maps’ messages and undermine all your hard work.
And as the preceding information suggests, no single map type is superior in all cases. It’s ultimately incumbent on you, the author, to choose the medium that best suits your message, resource availability, and audience needs. We hope this information provides some useful guidelines, but we also encourage you to experiment — after all, storytelling is an art, not a science!


Article Discussion: