
Since 2002, Blue Raster has helped global organizations and government agencies—including the World Health Organization, World Bank, UNICEF, USAID, and more—share their unique stories through interactive web and mobile mapping applications.
Two Blue Raster summer interns, Joe Nadonley and Kelly Motzko, recently shared a behind-the-scenes look at their first storytelling experience with the company and with the new ArcGIS StoryMaps Beta. As geographic studies majors at The Pennsylvania State University and James Madison University respectively, both have advice for fellow students and educators in secondary and higher education.
Meet the Blue Raster team at the 2019 Esri User Conference where they will feature a poster of their new Measuring Success story map in the Map Gallery. Check out their latest article to find them at the conference.
Read the highlights from our discussion with Joe and Kelly. -Esri’s StoryMaps team

When we first met, you were only a few weeks into your internship with Blue Raster, with a pretty big project on your plates. Can you tell us a little bit about the project and your role?
Joe: Blue Raster had the opportunity to create and present a story map using ArcGIS StoryMaps for Esri’s “The Magic of Maps: How to Engage and Inspire Your Community” event.
It was our first week on the job, and the story map was our first assignment.
The story itself, titled Measuring Success, goes into detail on how some of Blue Raster’s nonprofit partners are tracking progress of the United Nations’ Sustainable Development Goals. The story map addresses five of the seventeen SDGs and encompasses the work of The Demographic and Health Surveys Program, UNICEF, and The Nature Conservancy.
At the event, we were able to introduce our experience working with the new platform and give advice on how organizations can use storytelling tools successfully.

Your presentation was a great success with the local nonprofit and government representatives who attended the event. And your story map was highlighted in a recent ArcGIS blog post, 6 Great Stories Made with the ArcGIS StoryMaps Beta.
What storytelling or GIS experience did you each bring to the table as you sat down to create the story map?
Kelly: In the Summer of 2018, I had the opportunity to study abroad in Malta. I collaborated with NGO Nature Trust Malta and team members to analyze the impact of Malta’s trash on endangered sea turtles. The team was able to collect, analyze, and display spatial data on trash within a story map, and present their findings to the President of Nature Trust Malta and its members. The story map enabled our team to communicate data to both the organization and the public about litter and its effect on sea turtles. This piece was ultimately able to help NTM create waste-management solutions for the future. (View Kelly’s biographical story map.)

Joe’s academic experience with story maps was a bit more free form, as he was prompted to create an informational piece detailing the rise of any social trend in the United States. His choice – the increase in popularity of the sport of soccer—has been used as a teaching example within Penn State’s Department of Geography. (View Joe’s biographical story map.)

We love how your experiences have been so positive but also so different on substance. What was it like to collaborate on the Measuring Success story? Were there any challenges or lessons learned?
Joe: This really was our first experience joining a full-time team to create a product for a real client. It was very cool to see how the team came together with fresh perspectives and lots of innovation. The collaboration with the team, and even working with design files, was new and a great learning experience.
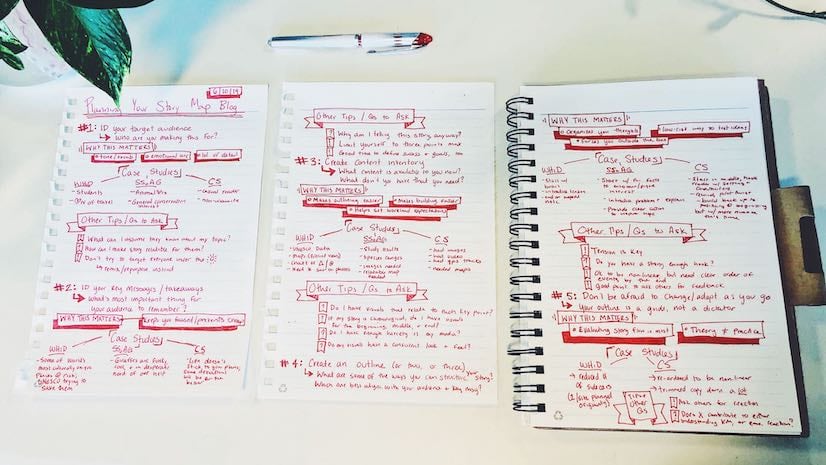
The team got us started with the basic principles of building a story map. For example, overarching themes and recurring graphics can assist the reader in keeping track of their “progress” throughout the story map and give a sense of continuity inside of individual sections. Our UI/UX designer used large scale, immersive images to create hierarchy and levels of importance within the story map. For the reader, this helps to connect abstract ideas to real-life people, places, and events. We also added interactive maps to help our audience grasp the geographic components of the story and spatial scale of the given topic. Blue Raster even has a basic story map checklist that helps kickstart the story map creation process.
The biggest takeaway, I think, was that we hadn’t really ever thought of a story map as an actual story. Yes, it seems obvious now, but using data to actually tell a story from beginning to end was eye opening.
Kelly: Agree—as was the focus on audience. For example, a scientific organization looking to express information to a scholarly audience might want to create a more text-heavy story map. A design that intersperses maps and figures to support their detailed findings and hypotheses will likely resonate with their audience. However, more common is the case of a nonprofit or other NGO that is looking to create an impact with the public. In this situation, less text and more vibrant images, interactive maps, and stimulating video can help to relay the importance of their cause to a non-technical or unaware audience.
Tell us a little bit about your experience with the ArcGIS StoryMaps Beta. How was it different from using the classic templates?
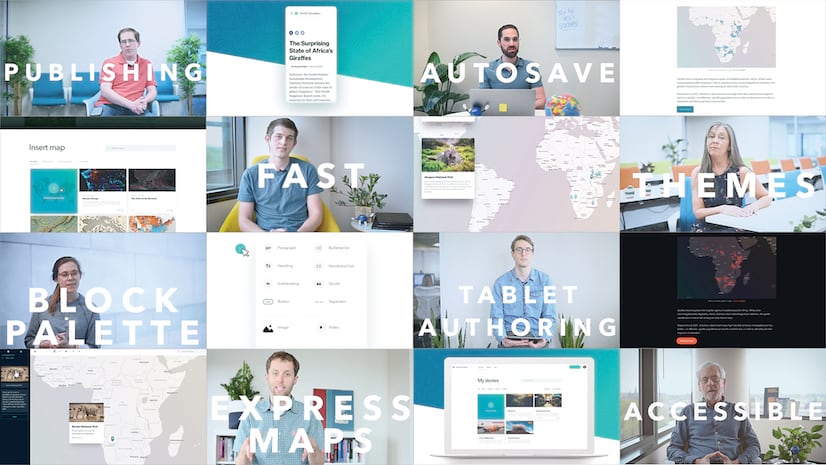
Joe: Becoming familiar with the interface for each classic story map template can pose challenges for users, especially those with limited experience. What’s great about the new StoryMaps platform is that individual components like headings, quotes, images, and interactive maps are extremely easy to add and manipulate. While remaining highly customizable, these elements are also unified under a single, professional theme. Having defined themes to choose from eliminates the tedious task of adjusting styles and formatting throughout a given story.
With recognition that there are many capabilities yet to be implemented, we would love to have a little more control over the layout and positioning of certain aspects, such as being able to adjust image sizes or choose the alignment of a block of text. Regardless, this new program will be a powerful tool for users from all backgrounds.

You’ve both had impressive experiences already, and you still have one year remaining in school. What advice would you give other students who might be interested in GIS or a related field?
Kelly: As students in geospatial programs, projects and assignments built around story maps were included in the required curriculum for some of our courses, often under the pretense of real-world scenarios or implications. I encourage other students to use story maps across all disciplines. The platform not only sets your work apart but also offers a more permanent product that you can point to later in job applications. You can even build upon the work you’ve already created.
Joe: My advice isn’t actually for students, but academics in general. Give students the opportunity to use story maps for presentations, other projects, even in non-GIS courses; and introduce story maps earlier. I wasn’t introduced to GIS or story maps until college. I entered Penn State with an interest in urban planning and policy; I just assumed that engineering was my only path forward. And then I was introduced to story maps and GIS. Now, I see how interconnected location intelligence is to urban planning and other degrees. And story maps were my gateway to new ideas and opportunities.

Article Discussion: