The challenge: Spend the day at Esri’s R&D Office in Arlington, Virginia. Create or enhance a story map for a federal agency using the new ArcGIS StoryMaps builder.
The real challenge: Finish and submit by 3 PM.
…..
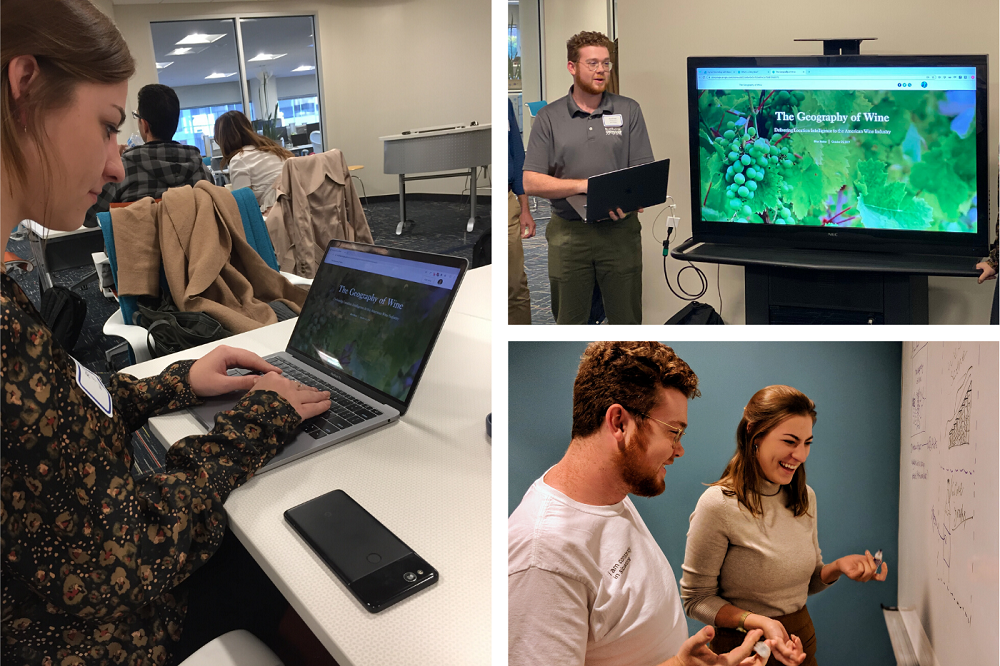
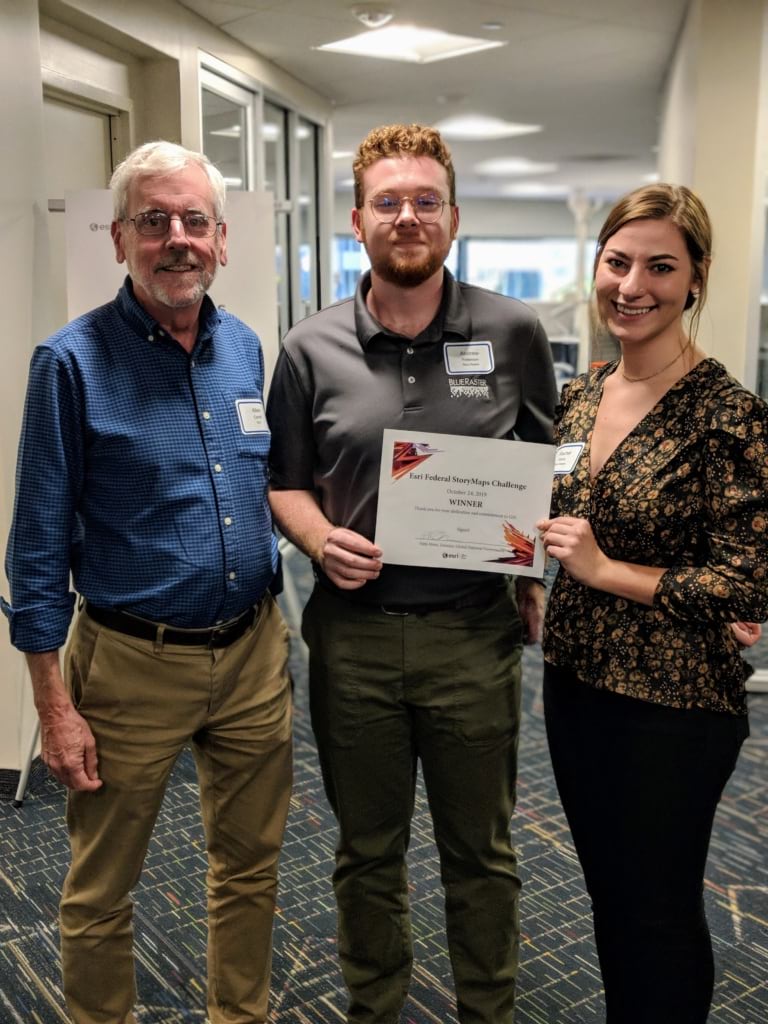
Rachel Stock and Andrew Patterson hopped on the DC metro early and headed over to the Alcohol and Tobacco Tax and Trade Bureau (TTB). Blue Raster’s The Geography of Wine story map was coming together with a strong narrative, maps, and imagery—but it needed a more personal perspective, one that only TTB employees could provide.
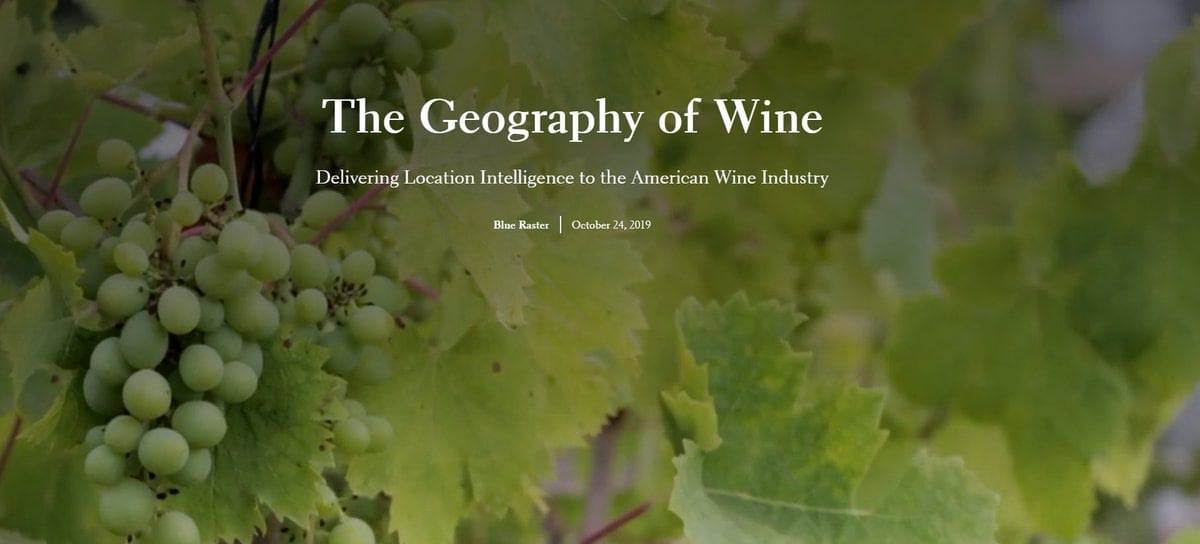
The Geography of Wine was their story, their vision for the TTB’s American Viticultural Areas program realized. And Blue Raster told the story well.
Since 2002, Blue Raster has helped global organizations and government agencies—including the World Health Organization, World Bank, UNICEF, USAID, and more—share their unique stories through interactive web and mobile mapping applications.
Blue Raster won Esri’s Federal Business Partner Story Maps Challenge for The Geography of Wine. Read our interview with Rachel, Andrew, and Chris Gabris—Blue Raster’s lead on the map digitization efforts—about their work with TTB and other federal agencies.
Connect with Blue Raster at blueraster.com. Contact Chris directly by email at cgabris@blueraster.com.

Congratulations, again, on winning Esri’s Federal Business Partner Story Maps Challenge. Can you please share a high-level overview of the winning story—The Geography of Wine?
Rachel:
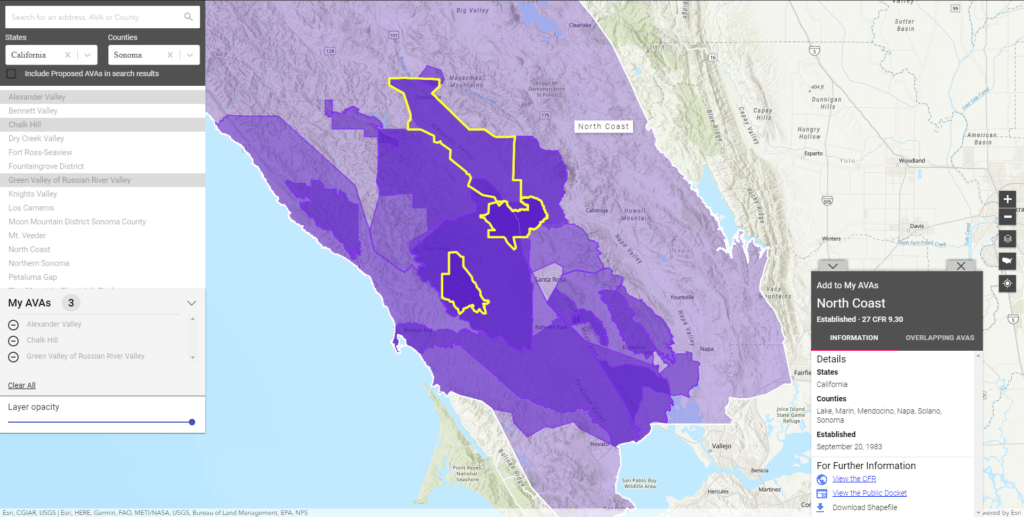
The Geography of Wine focuses on Blue Raster’s work digitizing over 270 American Viticultural Areas, most often called AVAs, for the Alcohol and Tobacco Tax and Trade Bureau. In addition to this work, we made the maps explorable to the public through the AVA Map Explorer application. The app allows readers to view current and proposed AVAs as well as submit proposals for brand-new AVAs.
After the challenge, you explained a bit about the work behind the AVA Map Explorer. Can you speak a little more about those efforts here?
Andrew:
Sure.
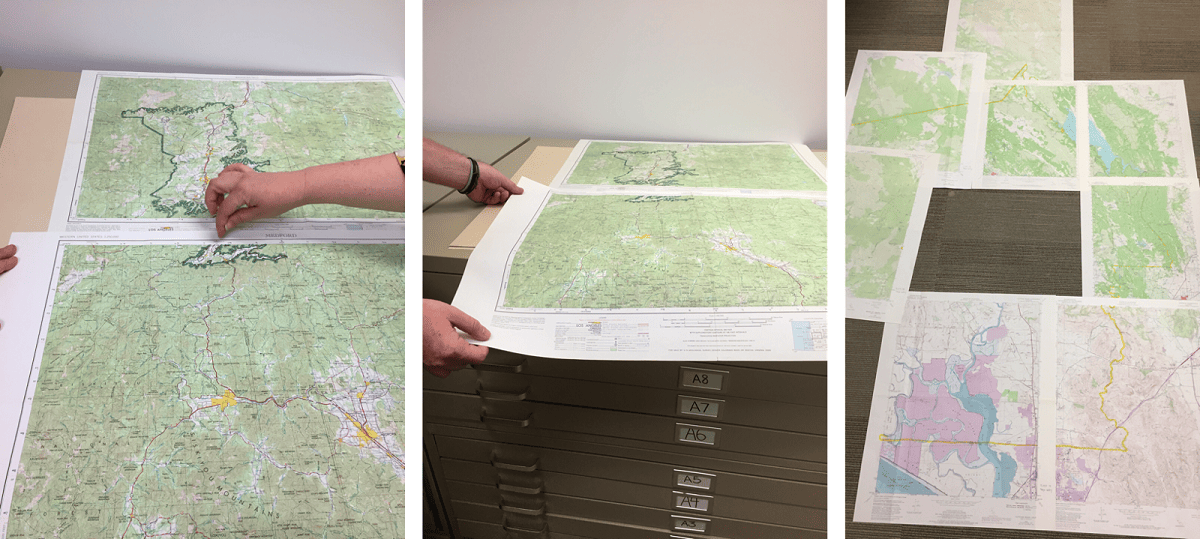
Since the introduction of specifically designated AVAs in 1980, TTB has been responsible for maintaining the physical records of all AVAs. This includes a written description of each boundary—which at times were both vague and very lengthy—and paper USGS maps where the AVA was drawn by hand. This means that any mistakes or edits are visible, as often times the maps were submitted with the boundary in pen or permanent marker and then edited for clarity.
In one case, this meant that a single AVA had its border drawn on 46 separate USGS maps because the AVA had specific physical features that were only visible at a finer map scale. The interesting thing about the submission requirements, however, is that only the border has to be submitted, so any map that is fully encompassed by the AVA doesn’t have to be submitted.
What’s nice about the digitized AVAs we created for the TTB using the Federal Registry is that this dataset is now the authoritative source for AVAs. Before this, it was possible to find polygons of certain AVAs which were created by different organizations and groups scattered about the internet. Now with the Map Explorer, all of them are accessible in one place.
Chris, thanks for joining the discussion. Your work digitizing the AVA maps is central to The Geography of Wine. Can you walk us through the process?
Chris:
Viticultural areas are designated grape-growing regions with distinguishable geographic features, and boundaries defined by TTB. The Code of Federal Regulations at 27 CFR part 9 contain the official names and boundary descriptions. TTB also has a map library with thousands of marked up USGS topographic maps that follow the written instructions and take into account revisions over the years.
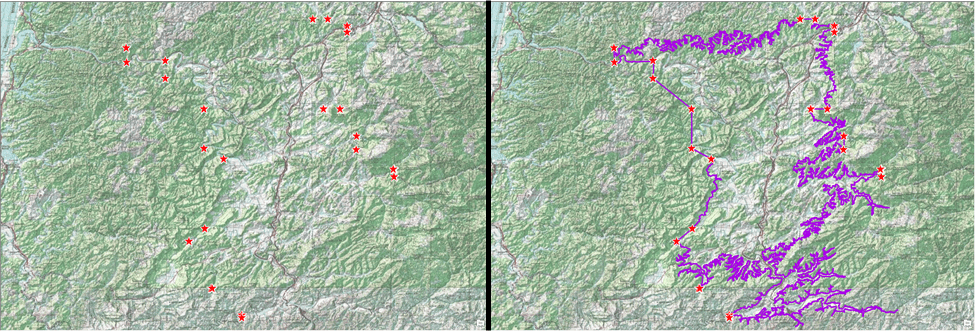
One AVA at a time, the team started the conversion from written instructions and paper maps to GIS by creating points for each CFR description in a Viticultural Area. For example, “Commencing at the intersection of State Route 90 with State Route 5 in Cayuga County, north of Cayuga Lake.” We used industry-accepted national datasets—including U.S. Census administrative boundaries and roads, USGS contours, and the National Hydrography Dataset— for the points. The connected CFR points formed viticultural boundaries. Draft versions of the AVAs were published to ArcGIS Online and shared with TTB staff in a Web AppBuilder application for review. With an intimate knowledge of the CFR, TTB staff was able to zoom in closer than ever to check boundaries for accuracy and confirm with the paper maps as needed.
How did those digital maps evolve into the AVA Explorer App?
Chris:
Mapped boundaries for web display and the AVA Map Explorer have been a long dream of TTB. The Blue Raster team met with TTB staff, and through multiple discussions, helped translate user stories for both for TTB and the public into an application designed to meet all those needs. The easy-to-use application helps TTB with wine labeling or vineyards petitioning for inclusion in an existing or proposed AVA. The application also allows the public to learn more about where their wine comes from. Individuals can enter an address to find nearby AVAs, search AVAs by name, apply state and county filters, or simply pan around and explore.
Because many AVAs have overlapping boundaries, the ability to compare AVAs was critical. Contained within a pop-up is information about overlapping AVAs, effective dates, and geographic extent. From the pop-up, users can also link to the CFR—which is still the official record— view the public docket of petitions and rulings, and download the shapefile of the AVA.
Chris, what challenges did you face when digitizing the maps? What advice would you give other Esri partners working with large agencies?
Chris:
The main obstacle was taking very large geographic areas described in text and digitizing into a highly-accurate GIS deliverable. Because the CFR was written decades ago for older AVAs, place names, roads, or other references may have changed. Using reputable GIS datasets for reference, a bit of investigation, strong attention to detail, and the knowledge of the TTB staff, our team was able to deliver a complete and accurate product.
The Blue Raster team was brought in as experts in GIS and web application design and development. As the project went on and Blue Raster’s knowledge of AVAs grew, the trust between Blue Raster and TTB grew as well. With AVA accuracy being critical, the ability of our team to provide TTB with tools for AVA quality control was extremely important. Once the AVAs were reviewed and finalized, designing and developing the AVA Map Explorer with TTB was a lot of fun. It was extremely rewarding to help bring a vision to reality with their team.
Rachel and Andrew, what prompted you to make a story map about the AVAs?
Rachel:
We work on a lot of projects at Blue Raster that are fascinating, so it’s always fun to have the opportunity to share the work we do. When we saw Esri’s challenge, it really inspired us to revisit the TTB project.
What really stood out to me about this project was how detail-oriented everything about wine is in the United States. Boundary lines, wine labels—they all have to be extremely precise. Since the ArcGIS StoryMaps application is so multifaceted, it was a great tool to help share some of those details.
People absorb information differently, so it’s really cool to have an easy-to-use tool that lets us share information in so many different formats. I love that the story I designed is a reflection of this, serving as a jumping off point for readers to explore and learn more about the viticultural process.
Obviously, your team won the Story Maps challenge. But after working together on other partner stories and presentations, we know that you have some great best practices for digital storytelling. Can you offer any advice to the storytelling community?
Andrew:
Before you begin, have a goal. Make sure you know where your story is going. Understand the purpose of your story, so you can keep it concise and keep your readers engaged.
And keep your maps simple. You don’t have to tell your whole narrative in one map. You aren’t limited to the number of maps that can go into a story map, so by using many stripped down maps instead of a single cluttered one you can tell the same story while not having your content be overwhelming.
Rachel:
Agree, and I would add: engage the senses. StoryMaps offers so many different ways to share your story—images, videos, interactive maps—and they all engage the senses in a different way. Use any and all tools you can to immerse readers in your story.


Article Discussion: