Every year, Esri’s Updated Demographics data is refreshed to reflect the latest population changes, helping you to understand the detailed dynamics of communities across the country. In 2026, one significant change to Updated Demographics is a new School Enrollment dataset that shows where students live and how enrollment patterns vary across neighborhoods—from preschool through graduate school. These new variables are designed to be internally consistent with local age structure and neighborhood characteristics, offering an intuitive, spatially accurate view that traditional sources have often overlooked.
This article introduces the new school enrollment categories, how they’re developed, and provides some suggested use cases.
Quick links
- Why This Matters
- Key Advantages
- How You Can Use it
- A Dataset Built for Spatial Analysis
- Explore Esri Demographics
Why This Matters
Traditional sources of school enrollment data like the U.S. Census Bureau’s American Community Survey (ACS) are valuable but may be challenging to use for small-area analysis. Due to statistical noise, age and grade-level estimates from ACS don’t always align realistically, making it hard to distinguish genuine patterns in the data. Additionally, ACS data reflects previous years rather than the current year, losing the more immediate information from recent local changes that can help analysts understand today’s education landscape.
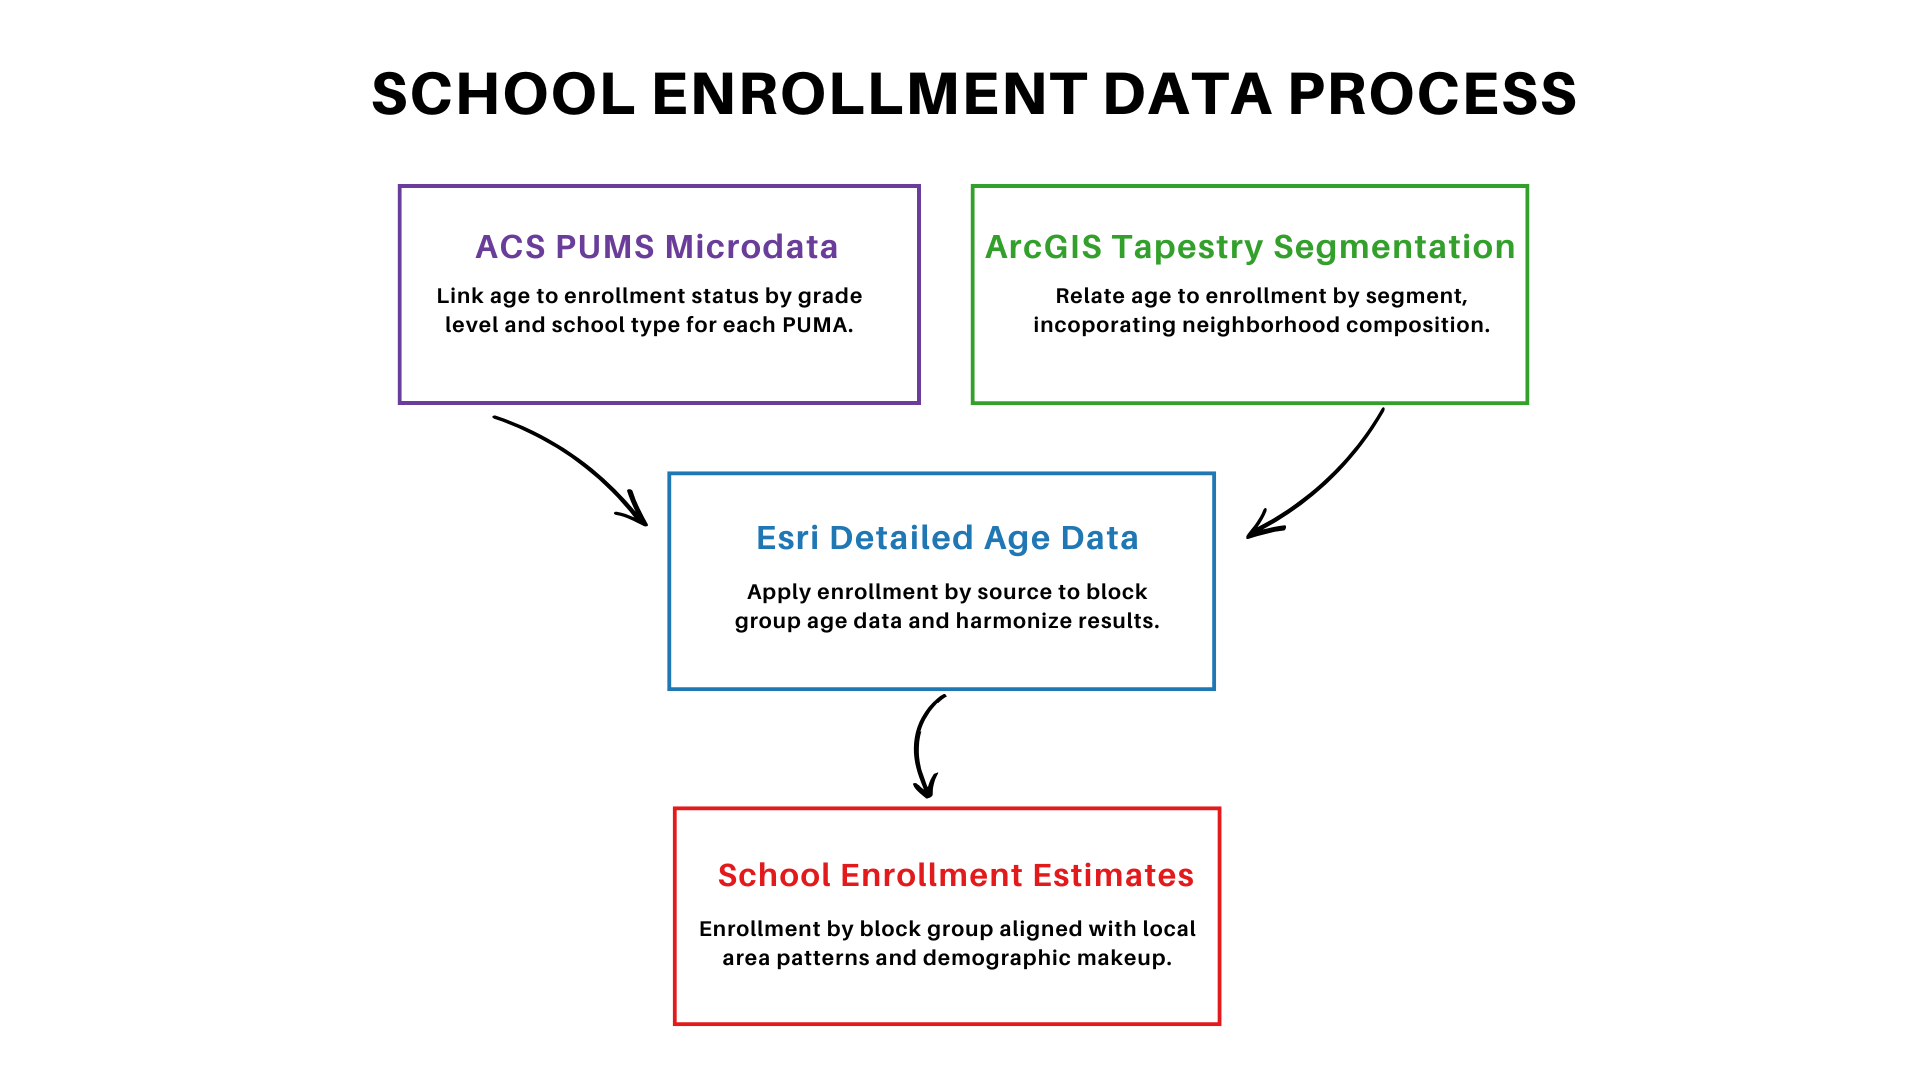
Esri’s new dataset addresses these gaps by starting with carefully developed age estimates for the current year as the foundation, then layering in enrollment patterns from ACS microdata and ArcGIS Tapestry segments to refine local enrollment. The result: current estimates that align naturally with local population composition, and patterns that are clear and consistent with related demographic characteristics.

Key Advantages
1. Age-Forward Alignment
A key strength of Esri’s new school enrollment data is that it uses an age‑forward estimation approach. This method starts with the premise that enrollment by grade level is closely tied to the age structure of the population.
The process incorporates ACS Public Use Microdata Sample (PUMS) data at the Public Use Microdata Area (PUMA) level of geography, preserving observed connections between age, enrollment status, grade level, and school type. These age‑specific enrollment patterns are applied back to Esri’s detailed age distributions at the block group level—ensuring that the results are tightly aligned with the local age structure. This matters because it provides assurance that:
- Kindergarten enrollment corresponds closely to the number of local five‑ and six‑year‑olds.
- High school enrollment stays within realistic limits based on the size of the teen population.
- College and graduate enrollment aligns with young adult populations, with adjustments made for group quarters (such as dorms) where applicable.
This age-forward approach keeps enrollment consistent with the underlying population, making the data easy to understand and compare.
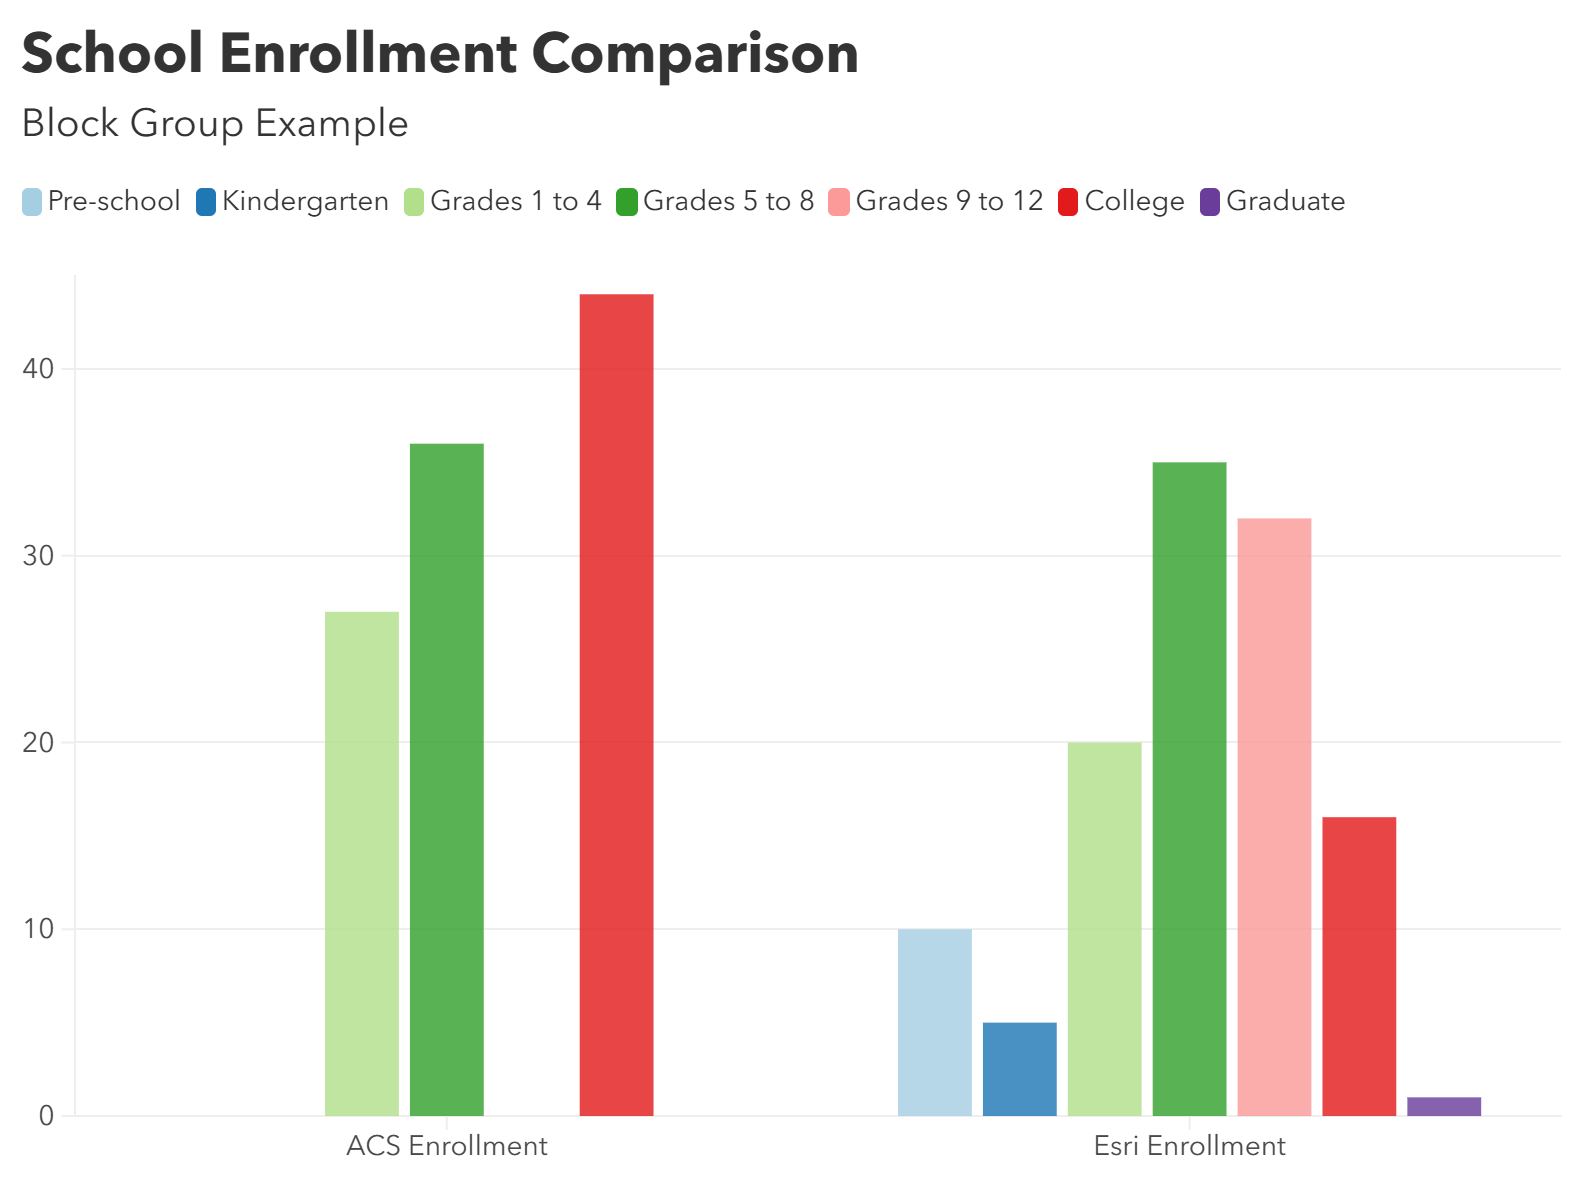
In this example block group, the ACS distribution showed zero students in kindergarten or high school, even though this community has many children whose age ranges are typically in those grades. While this can occur for a variety of reasons—including sampling variability—irregular enrollment distributions are common in ACS data at the block group level. In contrast, Esri’s estimates redistribute enrollment in a way that aligns more closely with the underlying population, producing a more balanced and demographically plausible pattern across grade levels.
2. Neighborhood Context with ArcGIS Tapestry
While age tells much of the story, an array of neighborhood characteristics refines it. Enrollment patterns are influenced by factors such as household composition, income, and housing type. Even communities with similar numbers of school-age children can vary substantially in enrollment rates.
To reflect this, enrollment estimates are harmonized with ArcGIS Tapestry data for each block group. This modeling approach combines patterns observed in ACS PUMS data with Tapestry‑based neighborhood attributes, resulting in estimates that reflect how enrollment can differ across communities. For instance, a block group in the Dorms to Diplomas segment will have a larger share of residents enrolled in college or graduate school.
3. Ready-to-Use Dataset
The School Enrollment dataset is available for all standard Esri geographies and provides enrollment counts for:
- Nursery/preschool
- Kindergarten
- Grades 1–4
- Grades 5–8
- Grades 9–12
- College (undergraduate)
- Graduate and professional school
How You Can Use It
Think of this dataset as a planning and exploration tool for understanding enrollment trends. You can:
- Compare school-age populations with enrolled populations.
- Explore how enrollment varies across different neighborhoods.
- Support site planning, outreach, and long-term community analysis.
- Add enrollment context to demographic or market studies.
Tip: These are modeled estimates, so for precise counts, complement them with local administrative data.
A Dataset Built for Spatial Analysis
School enrollment is dynamic and shaped by local conditions. By combining detailed age data, ACS PUMS microdata, and neighborhood context from ArcGIS Tapestry, the new School Enrollment dataset provides a rich, demographically consistent picture of where students are – and how enrollment patterns fit into the landscape. With this dataset, you can uncover patterns of community change, provide informed education‑focused planning and reveal how populations and schools intersect at the local level.
We look forward to seeing how you bring these insights to life in your own mapping and analysis projects.
Explore Esri Demographics
Esri Demographics contains more than 20,000 demographic and socioeconomic estimates created by Esri’s Data Development team. Topics include population, housing, Consumer Spending, Market Potential, ArcGIS Tapestry, and much more. Esri Demographics are available throughout ArcGIS:
- Find ready to use layers and maps from ArcGIS Living Atlas.
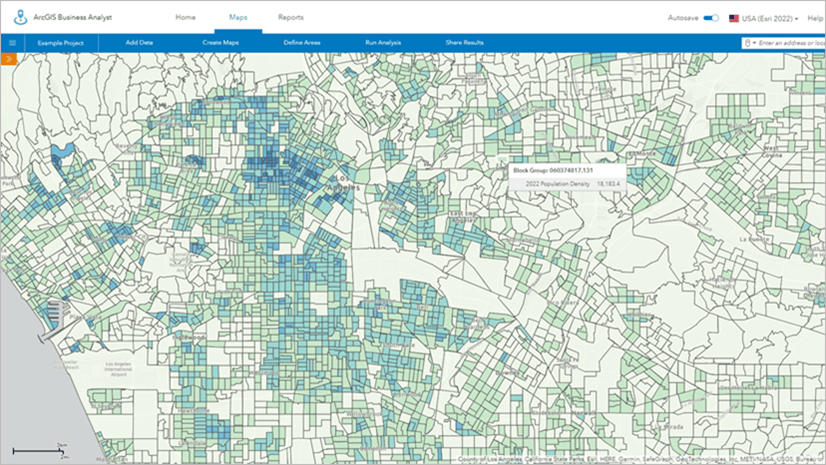
- Identify sites and evaluate markets with ArcGIS Business Analyst, demographic mapping software.
- Enhance workflows and apps with the ArcGIS GeoEnrichment service.
- Enrich your content with demographic data in ArcGIS Online using the Enrich Layer workflow and in ArcGIS Pro using the Enrich workflow.
- Buy Esri Demographics—Access high-quality, location-based data from the Esri Store.
Contact us at datasales@esri.com.


Article Discussion: