You have probably heard it before, maybe even repeatedly; enhance your business decisions with data-driven insights. But what does that mean? How can excel sheets or pie charts tell you where to put your new business? Or better yet tell you where to allocate city resources? Assuming organizations have the data needed to help them answer these questions, how does one go about applying this to the geographies they need to analyze? In this blog, we will dive into how GIS tools make this easy for organizations to remove a lot of barriers. We’ll start by answering a few commonly asked questions we hear around data analysis.
1. Where can I learn about the communities and markets I serve?
Neighborhood level insights are a powerful way to better understand a community, decide where to expand your business, and ensure resources are placed in communities with the greatest need. However, it can be difficult to learn about a market area from merely looking at Census data or from internal organizational data typically kept in spreadsheets.
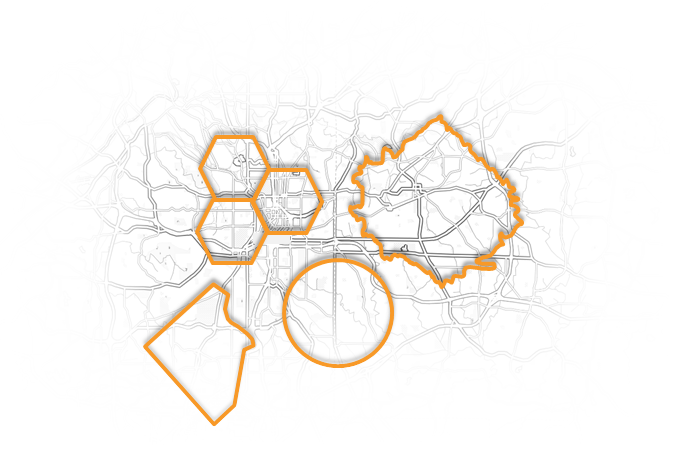
Enriching an area of interest with demographic, business, behavioral, and other location-based data helps you understand who lives in that specific area, what their lifestyles are, or what market opportunities exist around the area. In ArcGIS the ability to add location data into a specific area is called data enrichment or ArcGIS GeoEnrichment. What makes it so powerful is that the area you enrich with data can be a location, custom polygon, geographic boundary, or even a custom drawn area on the map. ArcGIS GeoEnrichment will return rich information about the people and places within the chosen area, allowing you to quickly learn relevant characteristics and lifestyles of the people that live there.
2. Where is the best place to expand my business?
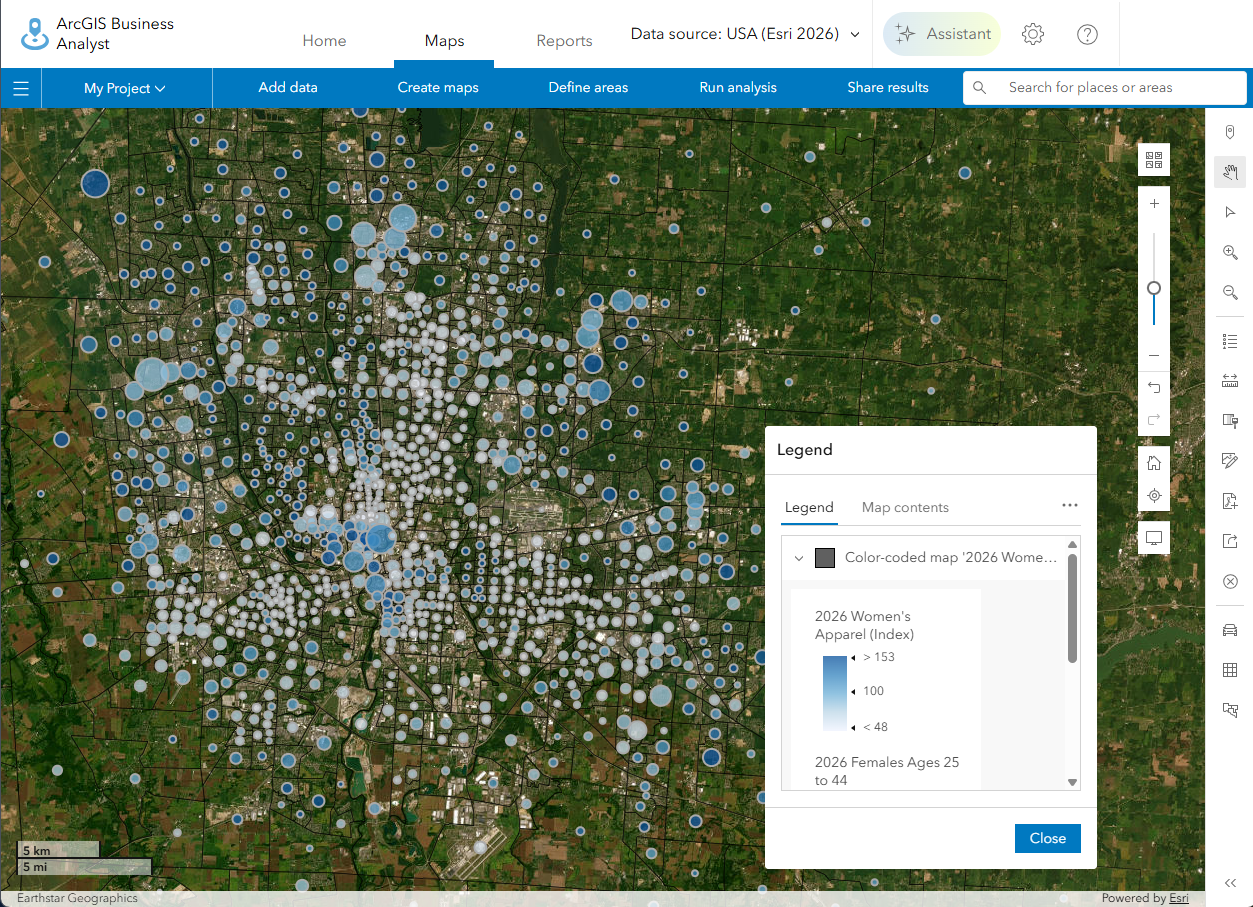
Understanding your market area or the communities you serve is critical for any business decision especially when looking to grow beyond your initial base. For example, imagine you work for a clothing store and have a target audience of woman between the ages of 25-40. Profits are exceeding the quarterly goals, so you decide to expand and open a second location. Due to the target audience, it is important for your organization to consider the demographic make-up of the neighborhoods you are considering expanding into. However, you might not be a demographer or even know what data to look at when going through the site selection process.
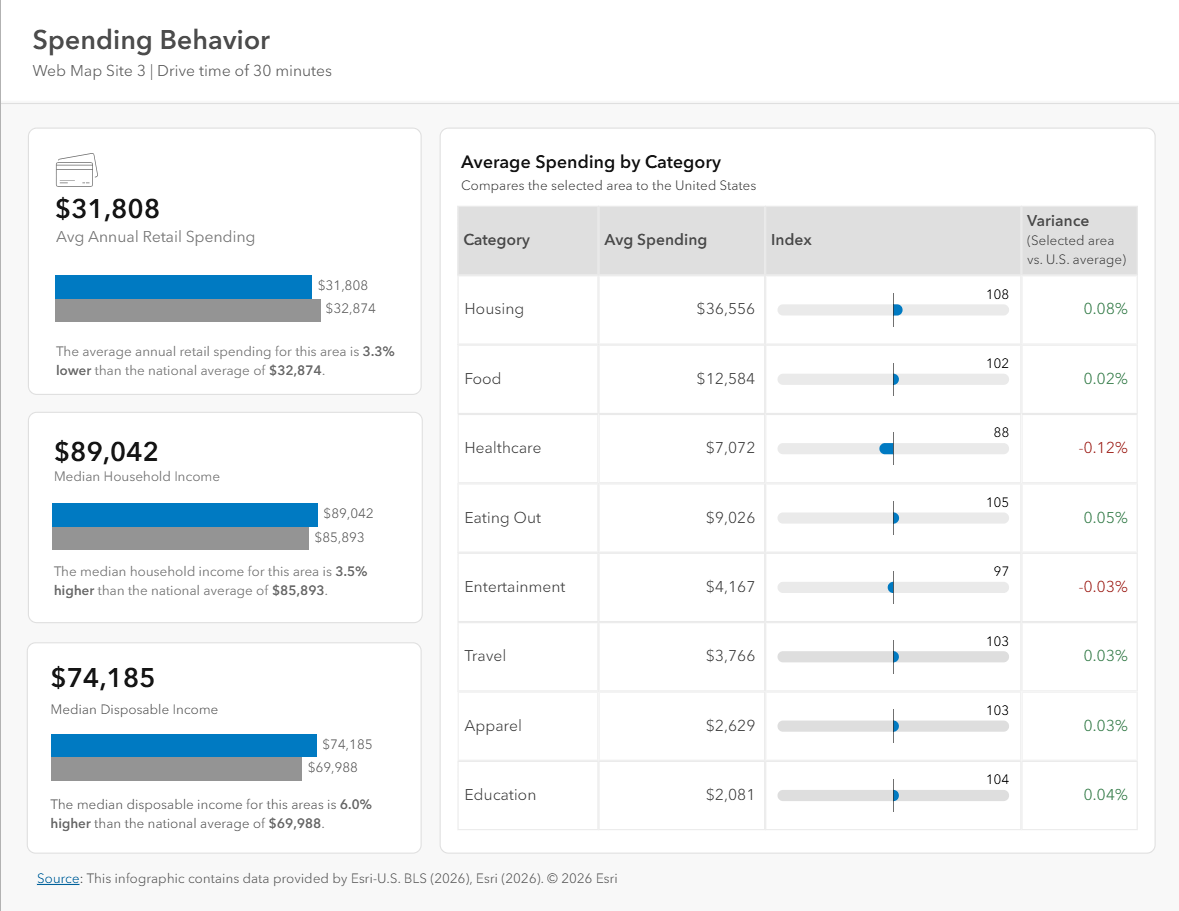
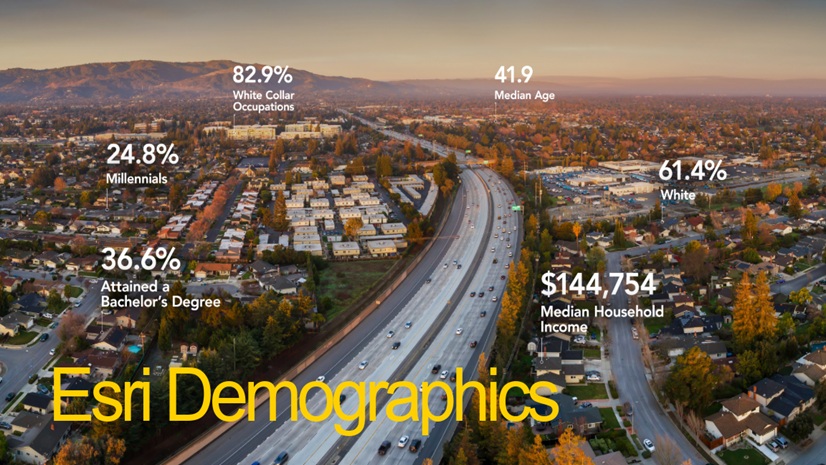
Esri Demographics data provides hyperlocal insights into lifestyles and behaviors as well as details on consumer spending habits. Enriching an area of interest with these details allows you to visualize whether the area would be a good place for your business. Instead of solely relying on Census data or data kept in spreadsheets, ArcGIS GeoEnrichment ensures demographic traits, market trends, and customer behaviors within a region can be analyzed via intuitive infographics and detailed reports.
3. If I have my own data, why would I need to use Esri’s?
Sometimes you don’t have all the information you need to make the most informed decision. Let’s take a fictional store’s sales data by territory. You can uncover additional insights by looking at your sales data per capita to compare territory performance. Or you could look at sales per number of businesses in the territory to identify opportunities.
So, whether you’re relying on Esri Demographics data or combining it with your own data, enriching your analysis area will strengthen your understanding of the market area.
4. How can I trust Esri’s data enrichment tools?
In this digital age, where information comes at pace and at volume, how do you know what to trust?
You look at where it comes from, how current it is, and how clearly these characteristics are represented and explained. Of course, behind those characteristics are human expertise and experience plus processes and data provenance.
GIS professionals, analysts, and developers can deliver the best possible information to support their work and their customers when they leverage this key data-powered capability in ArcGIS -– GeoEnrichment.
This combination of high-quality data and spatial analytics delivers the best possible information about the areas you are focused on.
- High-quality data: Esri Demographics consist of a comprehensive set of demographic, socioeconomic, and business data variables for over 170 countries and regions. The data categories span demographic and socioeconomic information such as population, income, households, housing, health, education, jobs, and consumer spending for a variety of products and services. While data for most countries come from trusted Esri partners, Esri’s U.S. demographic data is built in-house on a foundation of rigorous methodology, trusted sources, and decades of expertise. Esri demographers continuously refine models and methods to deliver highly accurate, up-to-date insights on population growth, decline, and demographic change. Unlike many public data sources that are updated infrequently, Esri releases its comprehensive collection of datasets annually, providing organizations with more timely information for decision-making. Learn more.
- Spatial analytics: GeoEnrichment employs a geographic retrieval process to allocate Esri Demographic data to custom areas using settlement patterns, land use, or building locations rather than assuming uniform distribution across an area. Learn more about the data allocation methods.
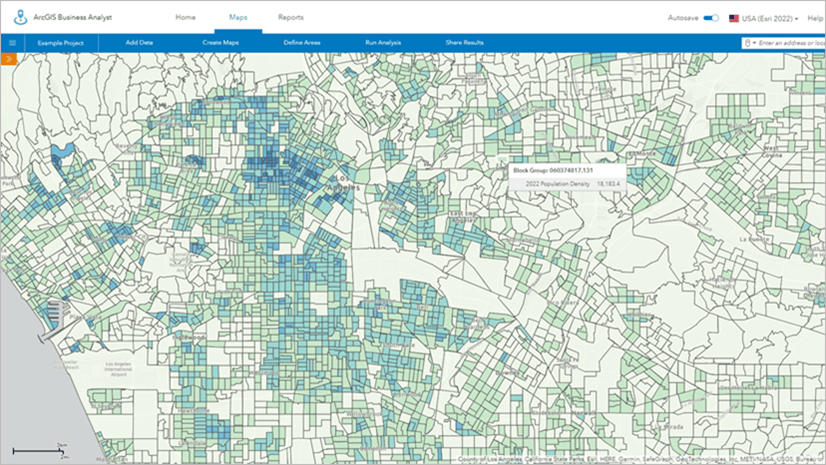
In conclusion, GeoEnrichment is available across ArcGIS. When you use the ‘enrich layer’ in ArcGIS Online and ArcGIS Pro, that’s GeoEnrichment. When you use Business Analyst to create infographics or perform a suitability analysis, that’s GeoEnrichment. When you enrich by point in ArcGIS for Excel or through GeoAnalytics Engine, that’s GeoEnrichment.
The next time you face a challenge where location is a critical part of the answer, be confident that using ArcGIS GeoEnrichment will deliver the best possible information to support your work.
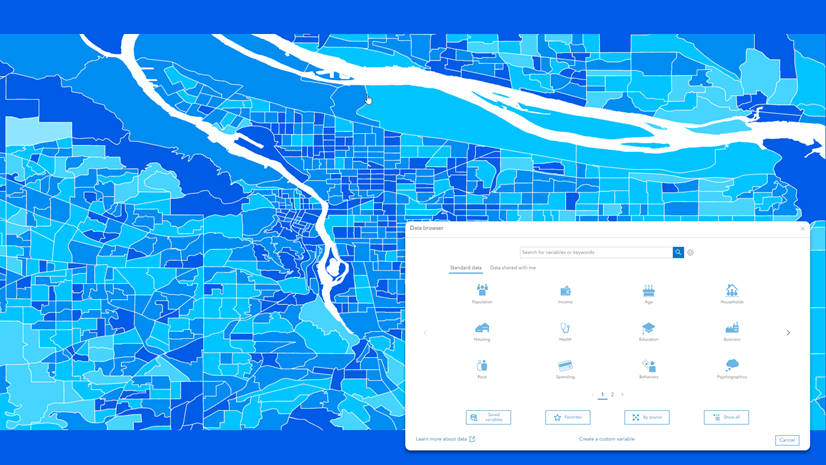
Explore the data browser to get a taste of the available data and start working with GeoEnrichment in your favorite ArcGIS experience!


Commenting is not enabled for this article.