The latest release of the Business Analyst extension for ArcGIS Pro is here – available with the ArcGIS Pro 2.3 release. This release includes four new tools and several enhancements. You can now visualize data and key indicators using the beautiful, custom infographics, bring in and use your own data alongside Esri Demographic data, and use the new Calculate Market Penetration and Create Trade Area Rings tools.
Here are the key highlights:
Use Interactive and Beautiful Infographics
Infographics allow you to summarize and visualize data and key indicators in a beautiful and interactive way that is easier and quicker to understand. Here’s what you can do with this release:
- Infographics are no longer just a pop-up – you can now dock or float them on the map.
- Interact with any of the twelve new starter templates – such as the popular Tapestry Profile or Key Facts and drill into infographic panels for more information .
- Access your organization’s custom infographics templates. Combine your own data along with Esri Demographics data to display it all together in a single infographic. You can build and share custom templates using Business Analyst Web.
- Drag-and-drop your favorite variables and use images and branding of your choice to quickly build custom infographics
This new capability is available to all ArcGIS Pro users (with or without the Business Analyst license).
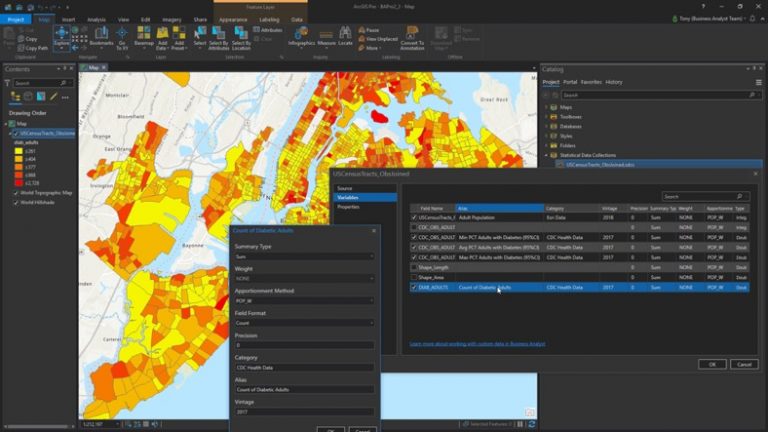
Bring in and Use Your Own Data Alongside Esri Demographics
Using your own data is an integral part of your market analysis. We have added the ability to use your own data in many Business Analyst tools, so you can, for example, enrich your trade areas with your own quarterly sales data and combine that with any Esri Demographic data. You can define how your data is apportioned or aggregated within ArcGIS Pro – much like the BDS layer from ArcMap.
Understand Market Penetration More Easily
Use the new Calculate Market Penetration geoprocessing tool to help explain why certain stores are performing well or not so well based on expectations. This tool identifies the percent penetration based on the number of customers within an area compared to a demographic variable such as total population or total dollars.

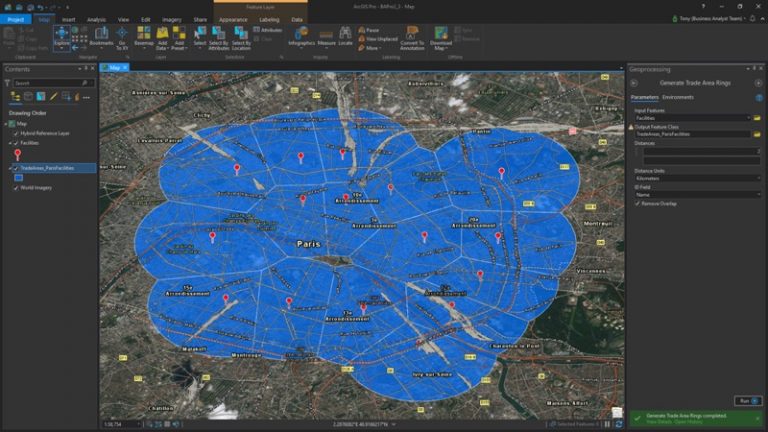
Create Trade Area Rings in Couple of Clicks
You are probably familiar with the Buffer tool. Using the Create Trade Area Rings tool in Business Analyst, now you can create buffers, or trade area rings around your layer of locations (e.g. stores or clinics) as well as remove overlapping boundaries. This is especially important to understand the market coverage of several nearby store locations.
And Much More..
Select one or more variable measures in Data Browser
You can now select multiple flavors of the same variable (Index / Count / Percent / Avg) in the same session. This helps you use multiple measures of the same variable at once when enriching your data.
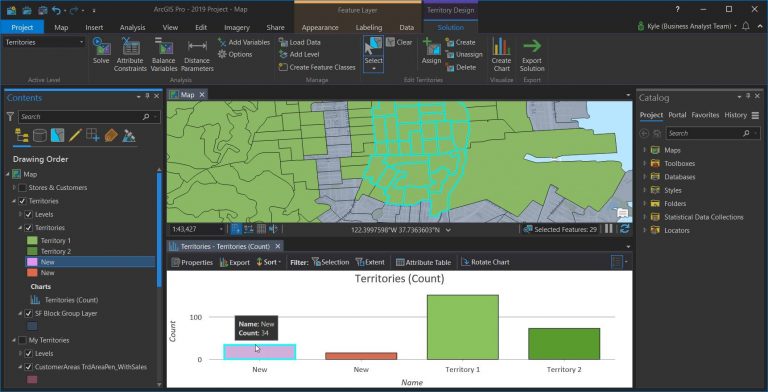
Apply Improved Constraints in Territory Creation
Additional options to support the ability to add attribute-based constraints to the automated territory creation workflow. Use “minimum”, “maximum”, and “ideal” constraints, for example, setup sales territories so each territory must have a minimum of 500,000 target customers and a maximum of 10,000,000 target customers.
Add Admin Geographies Interactively
Enhanced options to search and select from a list of administrative boundaries to create standard geography trade areas, for example, select all the ZIP Codes in San Diego County.
So that’s a quick recap of our latest contributions to ArcGIS Pro 2.3! Upgrade to the latest ArcGIS Pro and start using the new features today.


Commenting is not enabled for this article.