You just created an eye-catching map with presentation-ready infographics in ArcGIS Business Analyst Web App. How do you share your work?
There are four workflows to share your results: create a story or dashboard, share web maps and layers, or create an image or PDF. You can access these options on the Maps tab when you click Share results.

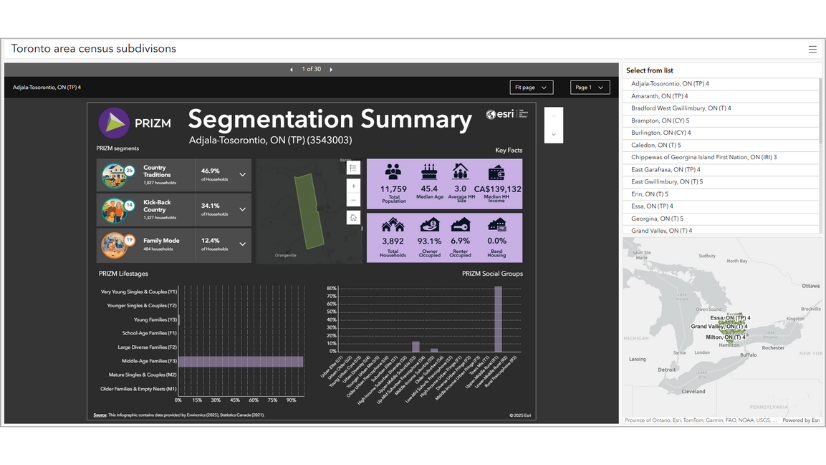
Create a story
You can share your sites, map, notes, attributes, infographics, and reports from Business Analyst Web App in a story using ArcGIS StoryMaps.
There are a few steps to creating your story. First, select up to 100 sites for your story and configure your story items. You can include maps, site photos, attributes, notes, an infographic, and reports for each site in the story. Once you’ve made your selections, you can still add or modify sites and story items.
When your story items are selected and configured, you can choose from one of four story layouts.

The final step is to enter item details, like a title and sharing options. While your story draft is being created, you can use other workflows. Once the story draft is ready, it can be edited and published using ArcGIS StoryMaps.
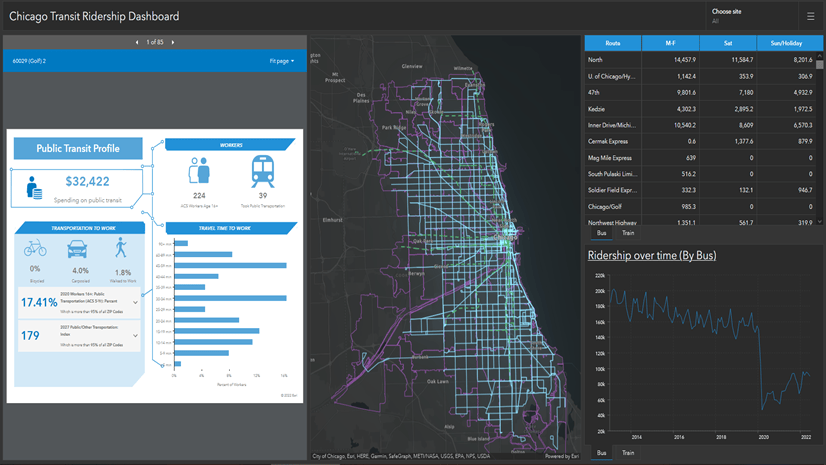
Create a dashboard
You can share your sites and infographics from Business Analyst Web App in a dashboard using ArcGIS Dashboards.
There are a few steps to creating your dashboard. First, select the type of dashboard, either with many sites and one infographic or one site with many infographics.

Choose a dashboard layout, such as side or main.

Now you can add sites and infographics based on the dashboard type you selected:
- For the Many sites, Same infographic dashboard type, select up to 500 sites for your dashboard and one infographic.
- For One site, Many infographics select one site and up to 100 infographics.
The final step is to enter item details, like a title and sharing options. While your dashboard is being created, you can use other workflows. Once the dashboard is created in Business Analyst Web App, it can be viewed and edited using ArcGIS Dashboards.
Share web maps and layers
In ArcGIS Business Analyst Web App, you can share the sites, layers, and maps currently open on the map as a web map in ArcGIS Online.
To get started, either click Share results > ArcGIS web map or click the Share map to ArcGIS button on the map toolbar.

You must enter item details metadata, such as a title and description, to share your web map.

You can use the Export map layers in a new hosted feature service check box if you want to share only some layers from your project. Instead of sharing the project with other users, add only the desired layers to the map, and use the Export map layers in a new hosted feature service option in the Share map window. You can then share the hosted feature service in ArcGIS Online with groups and organizations and in public web maps.
Additionally, exporting map layers in a new hosted feature service displays your map layer effects with some limitations. These include the following:
- Effects for site layers are not displayed.
- Effects for suitability analysis results that use points are not displayed.
- Effects for analysis areas and reference areas in void analysis results are not displayed.
Create a PDF or image
You can turn your map and analysis into a static PDF or image. This option is recommended when you need to capture something on screen. However, it is limited since the interactive elements of Business Analyst maps, reports, and infographics are not included.
To get started, either click Share results > PDF or image or click the Create PDF or image button on the map toolbar.

The workflow itself is streamlined. Pick either a PDF or image as the output and enter metadata for the item, like a title and subtitle. You can use the preview to see how the final result will look.

Since this workflow exports content, it consumes credits and presents in-app credit estimation for your awareness.
In conclusion
And that’s it! Those are the four workflows that you can use to share your Business Analyst Web App results.
Resources
Now that you’ve learned about how to share your results, we hope you’ll explore more capabilities in Business Analyst. To continue your Business Analyst journey, visit the following resources:
- Business Analyst product overview page
- Review pricing and purchase Business Analyst
- Business Analyst resources page
- LinkedIn user group
- Business Analyst Web App video channel
- Business Analyst Pro video channel
- Business Analyst on Esri Community
- Business Analyst Web App login page
- Email the team: businessanalyst@esri.com
This article uses ArcGIS Business Analyst Web App Advanced to create a story and dashboard. Business Analyst Web App Standard is used to share a web map and create a PDF.

Article Discussion: