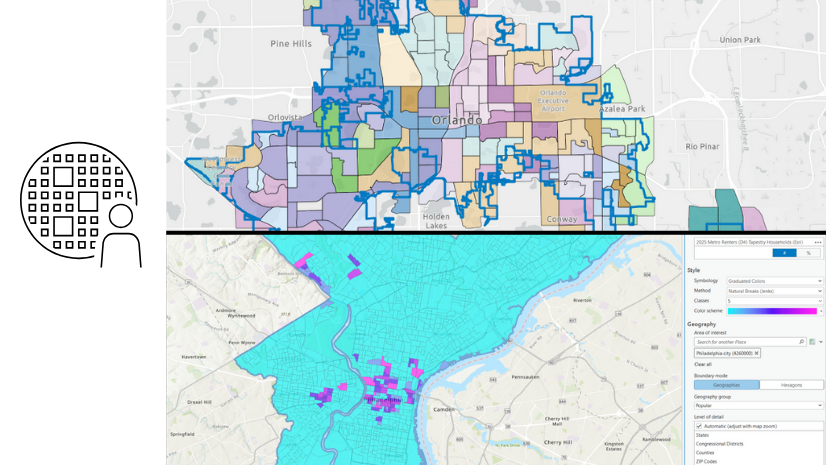
The data browser is a powerful interface in ArcGIS Business Analyst Web App that allows you to search for and add demographic variables to your maps, analyses, infographics, and reports. With thousands of variables to explore, the data browser can help you find data relevant to your project.
When paired with ArcGIS GeoEnrichment Service, you can add data to the geographic boundaries of your choice, such as counties and census tracts (standard geographies) or wards and drive-time areas (nonstandard geographies). This kick-starts any spatial analysis, bringing together the data you need and the places you’re interested in.
In ArcGIS Business Analyst Web App, the data browser plays an essential role when creating color-coded maps, performing a smart map search, conducting suitability analysis, building infographics, and performing other workflows.
First, make sure that the Esri 2025 data source is set.

What improvements are added to the Business Analyst data browser?
In the June 2025 release, there are some improvements and enhancements to the Business Analyst data browser. For example, users can now quickly select all their favorite variables in one click.

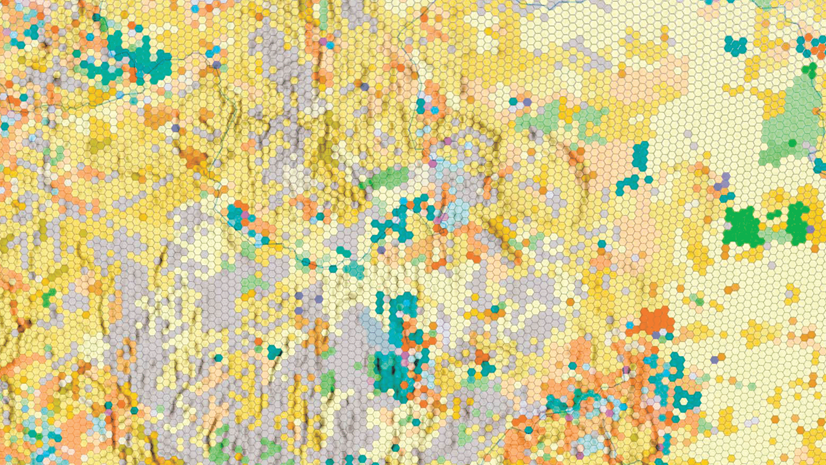
If you’re interested in Esri’s community segmentation system, ArcGIS Tapestry, you may notice that the data browser has an entirely different Tapestry data system. The June release celebrates the latest generation of Tapestry data, including reconfigured segments and LifeMode groups as well as comprehensive access to Urbanicity attributes. In the data browser, use the Browse by drop-down menu and select Dataset. Click the ArcGIS Tapestry tile and browse the new variables.

What new data has been added to the Business Analyst data browser?
The June 2025 data release brings an array of new variables to both U.S. and global demographic data collections, offering valuable insight into consumer spending, income distribution, and other areas of focus.
Esri Updated Demographics
Demographic data updates for 2025 and projections for 2030, aggregated to Esri’s 2025 geographic boundaries. There are 146 new variables, including household, housing unit, and population time series variables; contract rent variables; income and income inequality variables; and labor force by race variables.

American Community Survey
Demographic data updates spanning the years 2019-2023, aggregated to Esri’s 2025 geographic boundaries. There are 24 new variables related to homeowners insurance.

ArcGIS Tapestry
Tapestry data updated to the third generation, including 206 new variables.

Esri Consumer Spending
Spending data updates based on the most recent Bureau of Labor Statistics expenditure surveys for the years spanning 2022 to 2024, aggregated to Esri’s 2025 geographic boundaries. There are 72 new variables, including apparel and food at home estimates for 2025 and 2030.

Esri Market Potential
Consumer demand and preferences data updates based on the 2024 MRI-Simmons Survey of the American Consumer, aggregated to Esri’s 2025 geographic boundaries. There are 198 new variables, including leisure activities, Internet, TV viewing, sports, and finances.

Esri Urbanicity
Urbanicity type data is updated and aggregated to Esri’s 2025 geographic boundaries, including 10 new variables.

U.S. 2025 geographic boundaries
Geographic boundary updates based on TIGER 2024, the Office of Management and Budget (for CBSAs), The Nielsen Company (for DMAs), and TomTom (for ZIP Codes). New and altered boundaries include state legislative districts, Public Use Microdata Areas (PUMA), and tribal boundaries.
Additional resources
We hope that you find these new demographic data variables and data browser enhancements useful. For more information about the June 2025 Esri Demographics and ArcGIS Business Analyst Web App releases, check out these resources:


Article Discussion: