The newest release of ArcGIS Business Analyst Web and Mobile Apps is here! This includes several enhancements to the Web App including saving the current map state, improved Business and Facilities Search, side by side infographics comparison, and new color code mapping styles. The Mobile App now supports panoramic and 360 degree images.
Save your map state
Most of us have sometimes had to stop in the middle of doing an analysis in the Business Analyst Web App and turn our attention to something else. Perhaps you created a business search results layer, and then spent some time using the Web Maps and Layers workflow to add other layers from ArcGIS Online. Just when you were ready to launch Suitability Analysis, you were interrupted and had to shelve it for later. When you sign in again, wouldn’t it be nice if you did not need to spend time identifying and reloading all your sites and layers? That is, simply continue working on your project where you had left off? Now you can! Introducing the Autosave toggle – just turn the toggle on, and the state of your map will be saved when you log out or close your browser. The next time you sign in, you will be directed straight to the map with everything open just as it was when you ended your previous session.

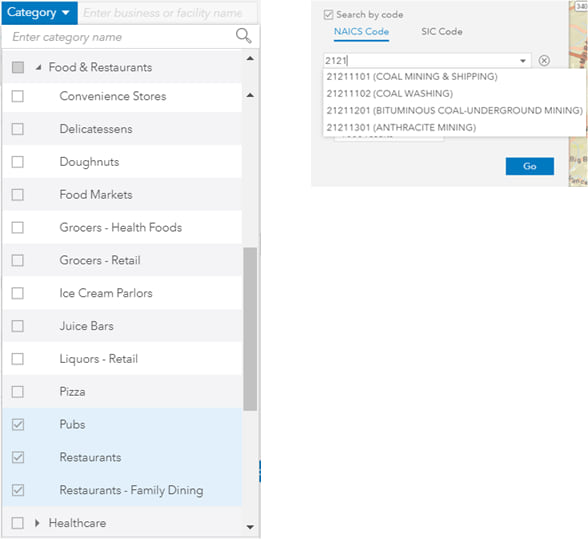
Use Business Categories to Search for Businesses
Select categories and/or subcategories within which to perform your business search. For example, if you work for the convention center in your city and need to provide conference attendees a list of things to do, you could select the Entertainment and Recreation categories. Or, say you want to open a new restaurant. Potential competitors would include existing restaurants and pubs, but not establishments with limited options such as delicatessens and pizza places. Instead of performing a generic keyword search for restaurants and going through a long list of results, expand the Food and Restaurants category and select only the Pubs and Restaurants subcategories.
Do you prefer to perform the search by NAICS or SIC codes? You, too, are in luck. You no longer need to leave the application to lookup the NAICS or SIC code directory. Simply click into the search box and press the space bar key to load the full list of codes, or type in a keyword to return related codes, or any number of digits to load all codes beginning with the same. You can select multiple codes for your search.
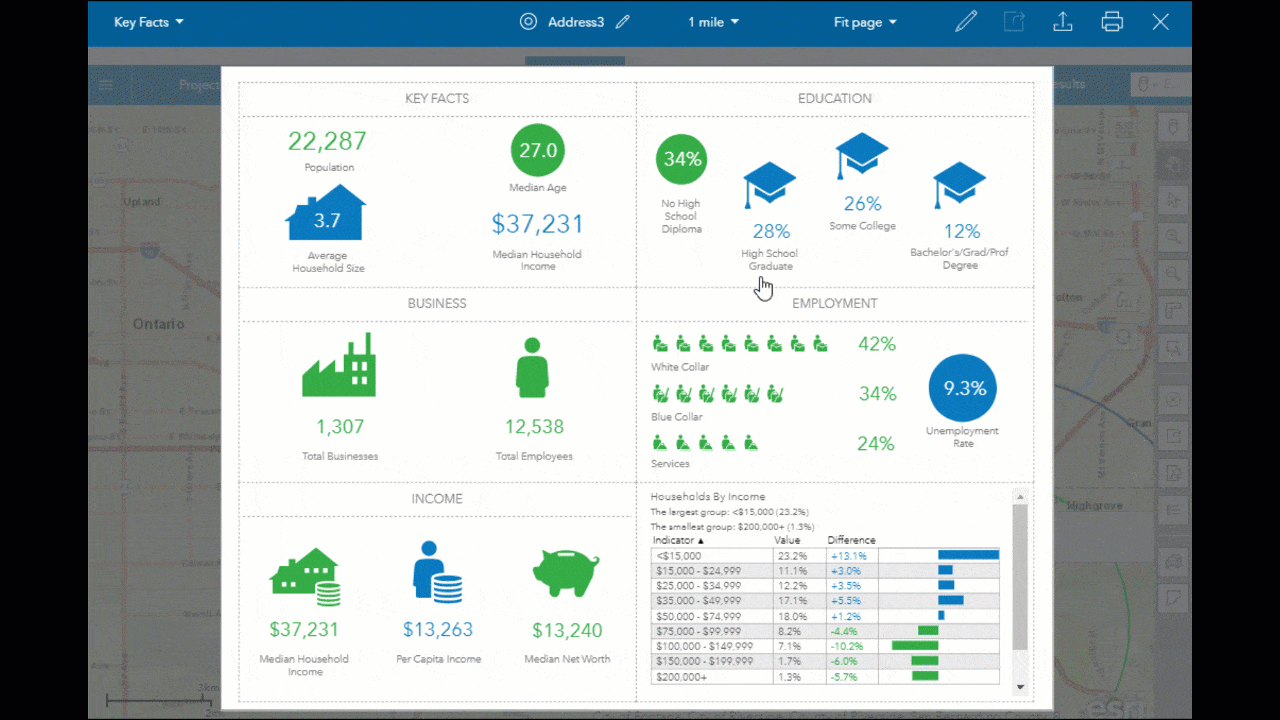
Compare locations using side by side Infographics
You can now view side-by-side comparison infographics for all the boundaries in your site. You can also add other sites to the side-by-side comparison infographic. When you run an infographic for your site, expand the area drop-down and turn on the Side by side comparison toggle to view the comparison infographics. You can also add other sites to the comparison.
New Color Coded mapping styles
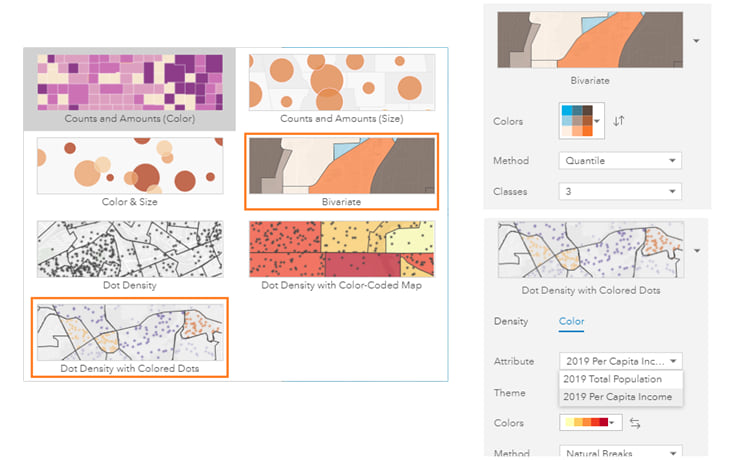
When creating a Color-Coded Map, you now have two additional style options: Bivariate and Dot Density with Color-Coded Map. To use Bivariate, you must choose two attributes in your data, and a single grid color ramp to classify both attributes on the map. For example, if you select Total Population and Per Capita Income, the features that have values in the lowest classes for both attributes will be represented on the map with the bottom left color from the color grid. For Dot Density with Colored Dots, choose two attributes in your data to be represented as a collection of equally sized dots: the first represented by dot density, and the second by dot color. Or, you can use the same attribute twice, classified by both dot density and dot color. This is a good style to use when you want to use dots to show count information such as the total population, shaded by a color classified variable such as per capita income. To do so, you will select Total Population as the Attribute under the Dot Density tab, and the Per Capita Income as the Attribute under the Color tab.
Data Update
With this release of ArcGIS Business Analyst Web App, we have some exciting updates to our data:
- Canada 2019 (Environics), Netherlands 2018 (4orange) data, Germany 2019 (Nexiga) data, South Africa 2019
- Updated US Shopping Centers, Business and Traffic data
- Esri Japan Dual Language Dataset 2019 – when the browser language is set to Japanese, the data categories and variable names in the Data Browser will be shown in Japanese.
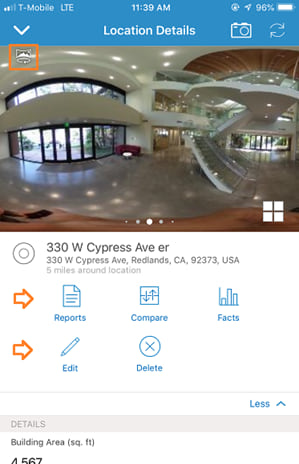
See 360 degree and panoramic images for your sites using BA Mobile
Panoramic and 360 degree images convey a more immersive view of a location. The Business Analyst Mobile app now allows you to add and view these types of photos for your sites. Just use your phone’s camera app to take panoramic and 360 degree photos, and then add them to your site in the Business Analyst mobile app. When you open these photos from the site details, you can swipe to pan and see the full panoramic or 360 degree view. The Location Details panel also has some other enhancements, such as the options to Edit or Delete the site, and more prominent access to reports.


Commenting is not enabled for this article.