Business Analyst allows users to organize their own data and integrate it into all analyses. This user-configured data, known as a custom dataset, can appear in the data browser and supports data apportionment so that it can be used with trade areas and user-drawn shapes. A custom dataset is typically created using a formal geography such as counties, ZIP Codes, places, DMAs in the U.S. or Census, administrative and postal areas globally.
Small-scale postal geographies, such as ZIP Codes, change frequently because they represent delivery routes. As those routes—and the number of houses and businesses serviced by the postal organization—change, the delivery area changes. In the U.S. there are 32,297 5-digit ZIP Codes in Business Analyst as of June 2023. In the United Kingdom there are 9,522 Postcode Sectors, while Sweden has 10,596 5-digit post codes. Postal boundaries can change as frequently as weekly. To minimize impact to users, we only update boundaries in Business Analyst annually. Users can use Custom data setup to support more frequent updates based on their use cases.
What type of changes occurred to standard geographies in the U.S.?
Since last year’s update cycle in June 2022, many of the 11 geographic boundaries Business Analyst supports have changed. You can read a great article by my colleague Garry Burgess on migrating historic sites to the 2023 data source which I encourage you to check out.
Updates typically include additions, removals, and renaming of areas. For example, this year’s release introduced the 118th Congressional Districts but the number of districts remained fixed at 436. California lost a district, as did Illinois, Michigan, Ohio, Pennsylvania, New York, and West Virginia, while Colorado, Florida, Montana, New York, North Carolina, and Oregon gained a district. Texas gained two. The remainder of states saw no changes in the number of seats.
At the ZIP Code level, an additional 85 residential ZIPs can now be found in the data and others were changed. The Places dataset was expanded from 31,615 locations to 31,893. Changes to DMAs and CBSAs were also made without changing the number of units of geography. For DMAs, there were no name changes this year but there were over 20 changes to the county compositions/boundaries of some DMAs this year. See the Demographic Release notes for specific details of DMA and other geographic changes.
How do changing geographies impact my work?
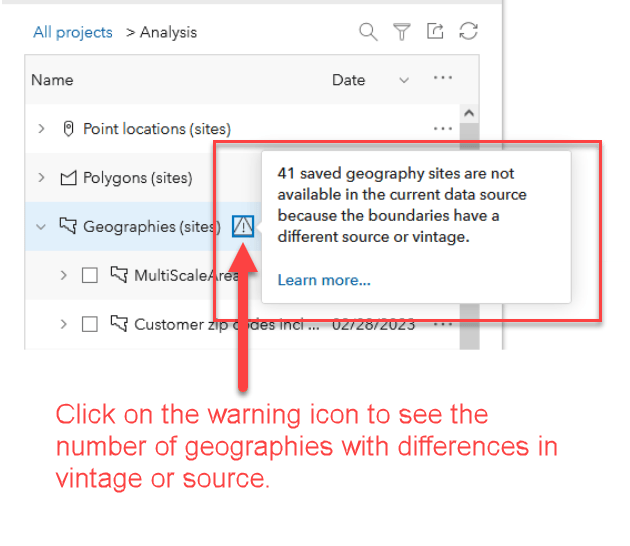
These changes could impact some of your previously created geography sites. As a result, we made the deliberate decision not to migrate every saved geography site that is based on previous vintages of these changed geographies. This means that when you switch to using the 2023 data, some of your old sites will not be available. Business Analyst detects the changes to boundaries using a combination of source and vintage, flagging standard geographies that are impacted. Most standard geography sites will still be available with the updated data and the sites that have not changed will be automatically migrated to the new vintage. For those geography sites that cannot be migrated, you will see a warning icon with mouse-over pop-up message, as shown in the screenshot below.
You will need to recreate standard geography sites for Census Places (Cities and Towns), Congressional Districts, DMAs, and ZIP Codes to use them in the 2023 data because the boundaries have changed. You can still access the original geography sites in the Esri 2022 data source.
Why can’t Esri just migrate the changed geographies?
While we can identify individual standard geographies that have changed, items stored in the My Geographies layer and other customer-defined geography layers can contain combinations of areas that are dissolved into one polygon, including any of the changed areas (ZIP Code, CBSA, DMA, and Congressional District). Those changes can be highly complex, especially when they contain combined areas.
Another challenge is the fact that changes occur across different vintages of data. Business Analyst supports data from 2021, 2022, and 2023. Some areas may have been migrated from 2021 to 2022 and the original source history would be lost. Geographic filtering occurs across different vintages and only geographies valid for a specific year are now shown with each demographic release. If the boundary of an area has not changed since it was originally created, it will be shown in subsequent years, but geographies that have been created in future years may not be shown in past years. This is because boundary changes cannot be retrospectively applied to a past year’s vintage of data.
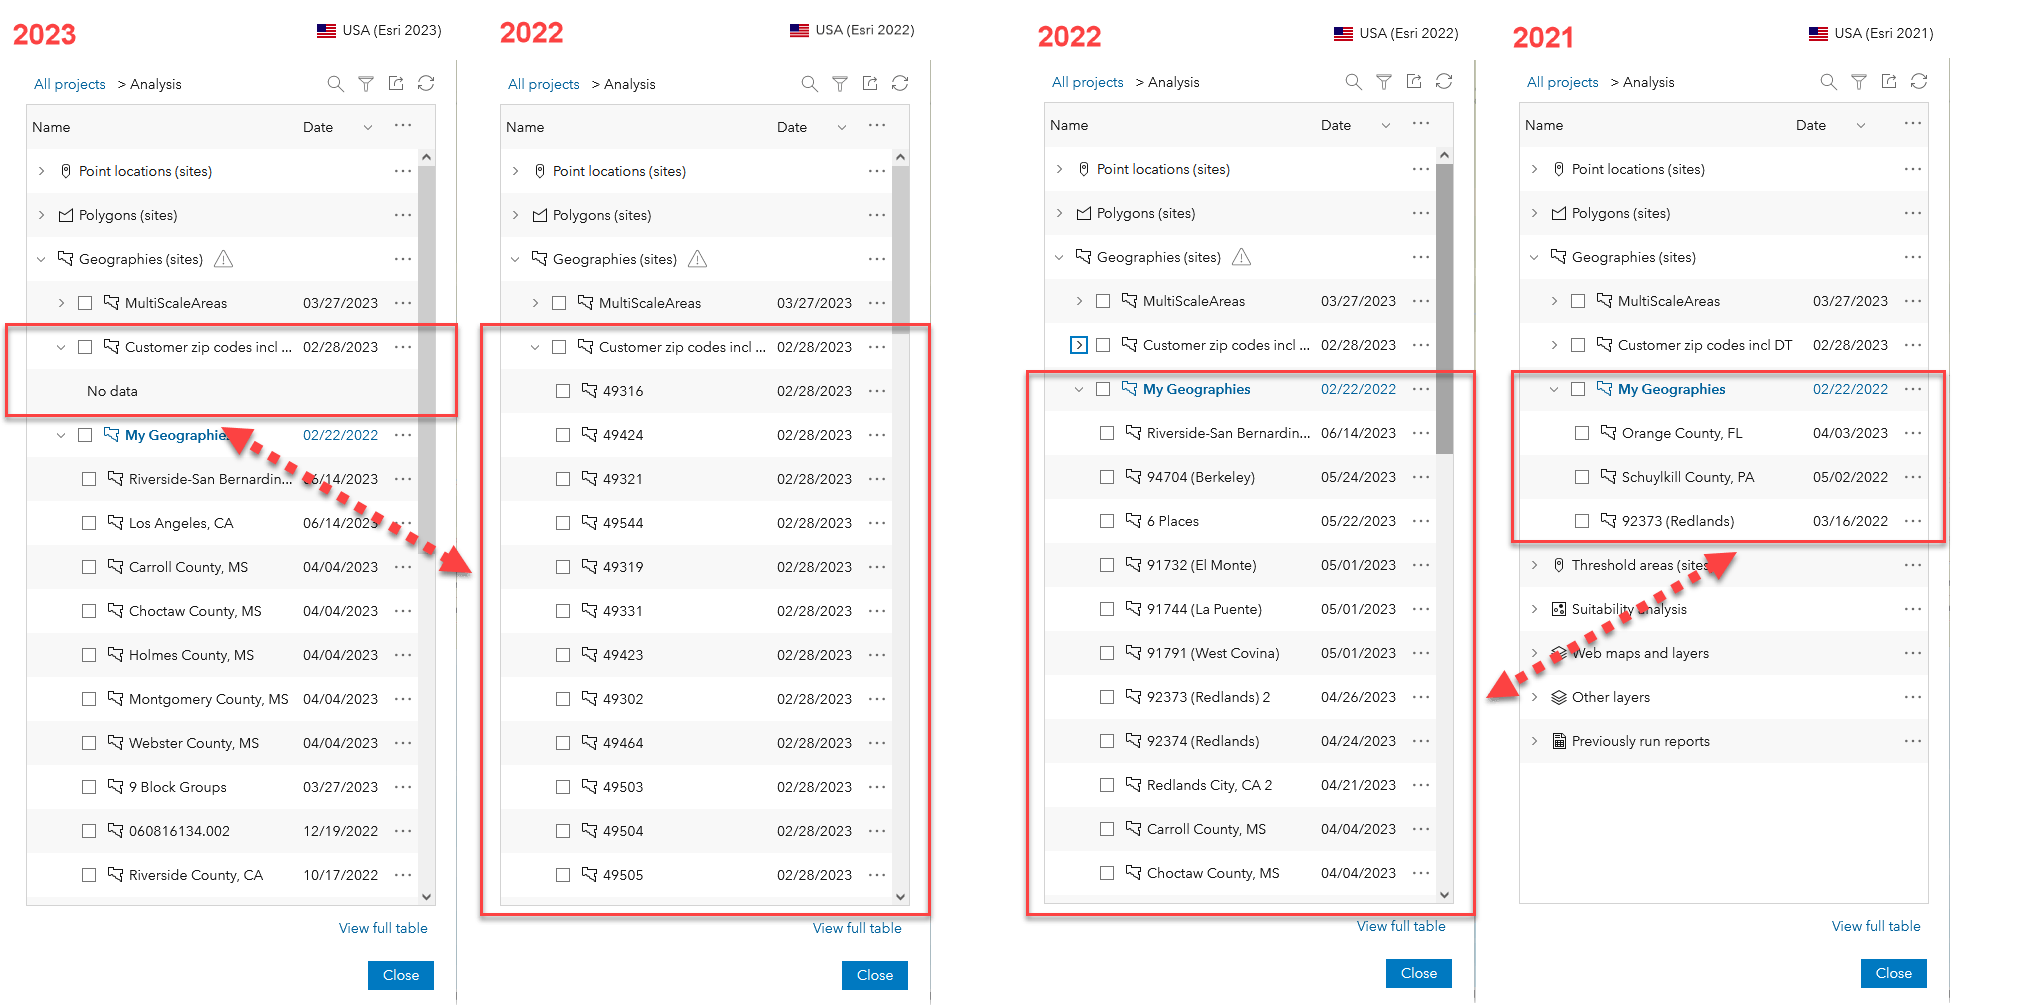
For example, as shown in the screenshots below, I mapped the ZIP Code 92373 using the 2022 vintage of geographies. When I switch years to 2021, this ZIP Code is visible in my project. This is because the ZIP Code boundaries were the same in 2022 as those published in 2021. However, when I switch years to 2023, this ZIP Code is not shown because the boundaries have changed in the latest update.

Another example is all the customer-specific ZIP Codes (also called Customer zip codes) created in February 2023. These were defined using 2022 ZIP Code vintage boundaries because it was prior to the new 2023 release. These are not available when switched to either 2021 or 2023 data because we do not allow areas to be analyzed retrospectively (for 2021) or when geographies have changed (between 2022 and 2023). Other areas using places (Cities and Towns), DMAs, and CBSAs are also not shown in the list when switching between geographies.
How Do I Know What Geographies Have Changed?
Currently, there is no tool that directly highlights the individual geographies that have changed. The banner warning provides more details on the number of geographies with a different source or vintage as shown below.

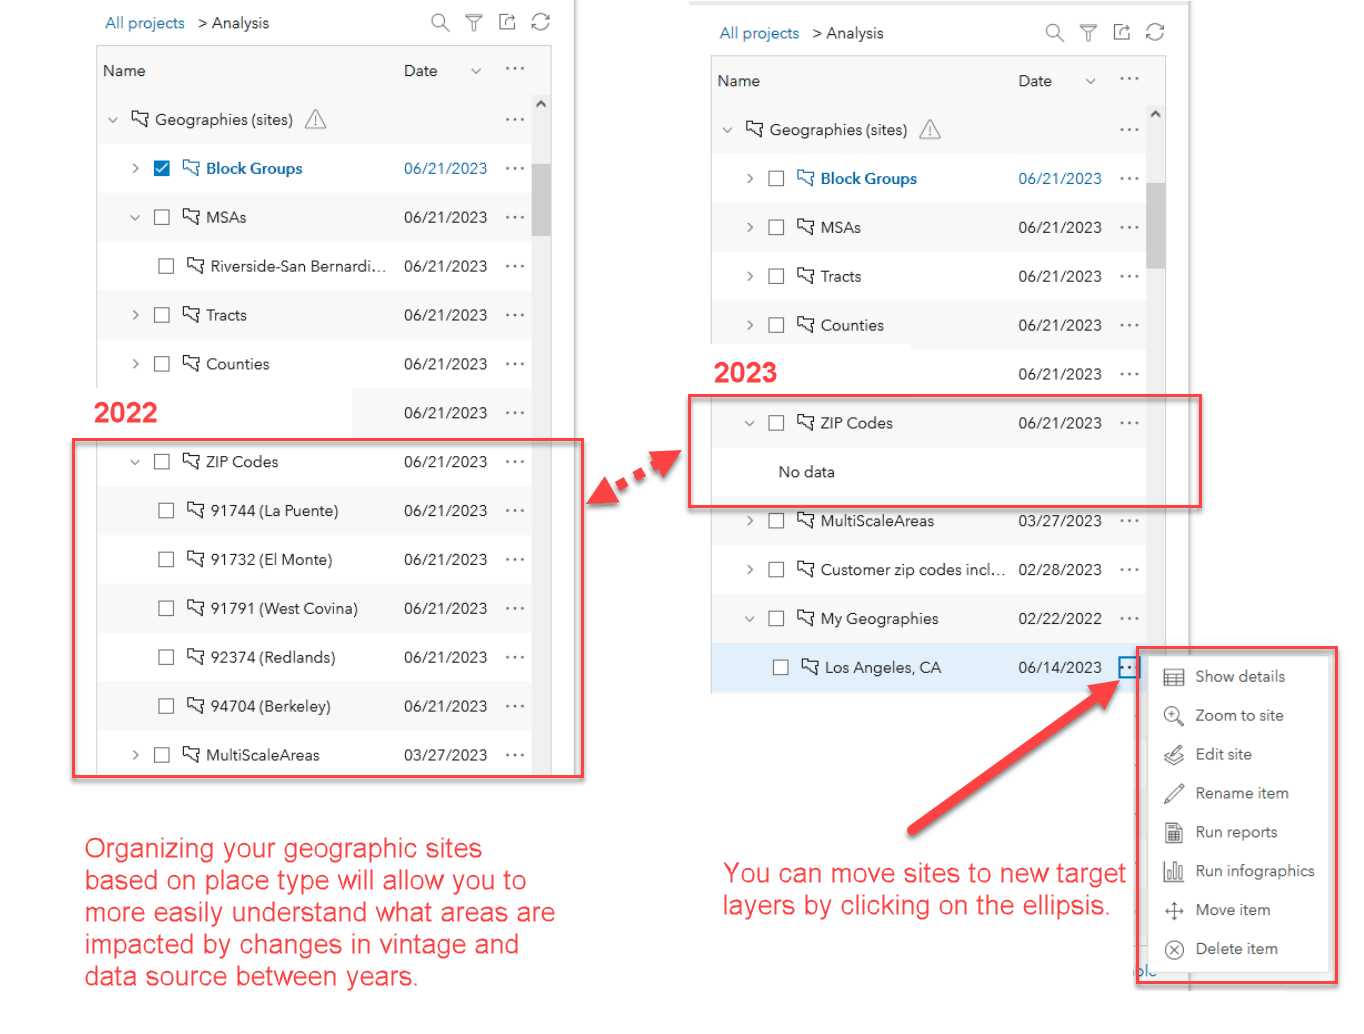
Organizing your geographies into different place types like Tracts and Counties, CBSAs and ZIP Codes, as shown in the screenshot, is a good best practice. You can add different geographic layers with the Geographies (sites) table of content. You can create multiple groupings of sites, in addition to My Geographies and set them as the target layer when you select geographies for analysis.
This best practice will not only help you maintain more organized sites but it will also enable you to see which of your sites have changed between years. In the example below, 5 ZIP Codes that I analyzed on 2023 are based on 2022 ZIP Code boundaries. All five have changed in the last year, so they are not shown in the table of content when switching to the 2023 content.
Organizing my sites into different types allows me to quickly see the differences between years. To reorganize your sites, click on the ellipsis and use the Move item option to select a new target layer.

What about custom datasets? Why don’t I see them when I switch years?
Custom data setup is a popular way to bring in your own data using standard geographies and create analysis, reports, and infographics that function the same as Esri’s own demographic data. Custom datasets are tied to a specific set of geographic areas and, consequently, vintages. If the underlying geographic areas change between years, your custom data will not be brought forward into the next year. This is because, like items in the My Geographies layer, custom data setup is tied to that specific combination of year and geography. Swapping back to the year in which the data was created, or a year with valid geographic consistency, will allow you to use your custom datasets.
What about custom data variables in reports and infographics? What happens with them?
Infographics and reports are also tied to a specific combination of year and geography. The vintage of data is stored with the report and infographic metadata. Esri provides a tool to migrate standard variables between years for Esri variables as well as custom variables created using calculations. Due to the complexity of validating geographic changes and data vintages, we do not provide an automatic way to migrate custom dataset-based variables that are used in reports and infographics across different years. You need to first migrate your custom datasets to a future year and then update reports and infographics.
How do I migrate my custom datasets?
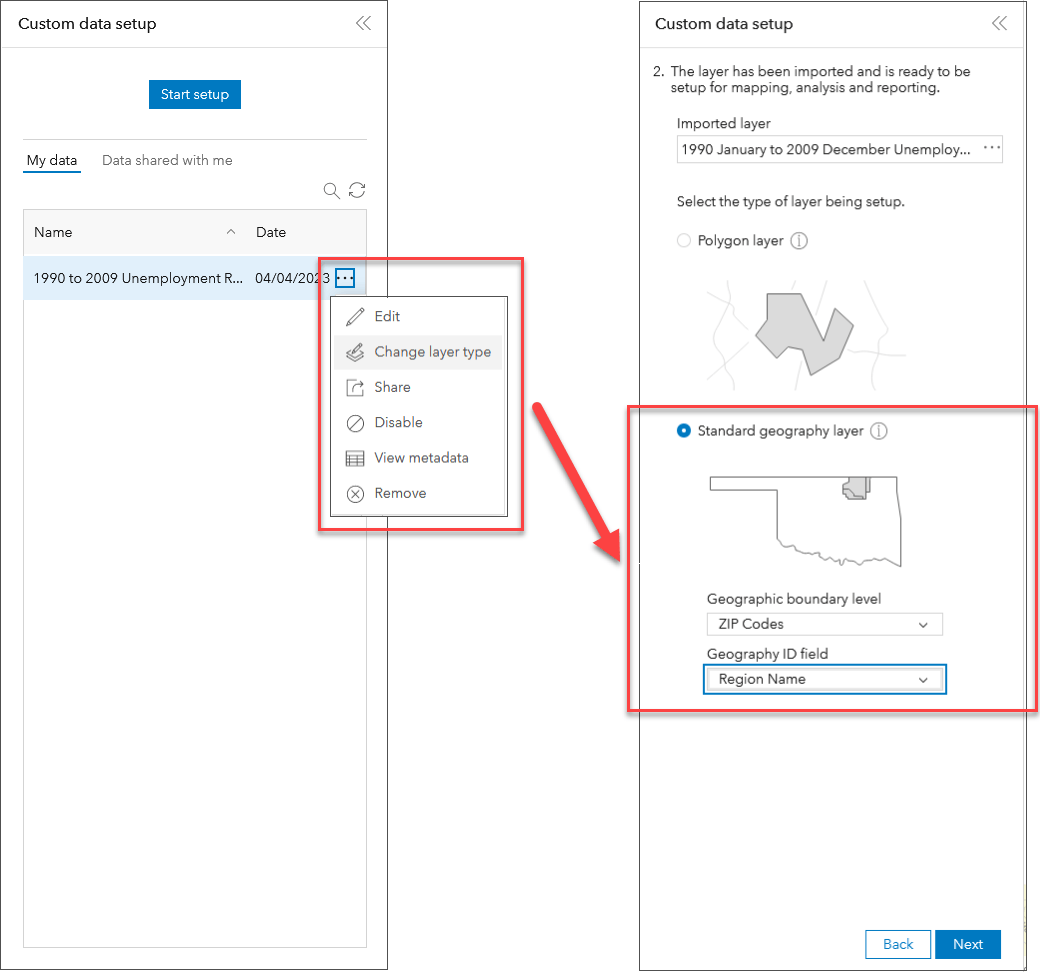
You can migrate custom datasets between years using the Change layer type process. Go to Add data > Custom data setup and then use the change layer type option as shown below. On the next panel use standard geography, reselect the appropriate boundary type or level, and the set the Geography ID Field. This will then update your existing custom data to use the current boundary set.

Note that this should only be done if you want to force your custom dataset to use the latest geographies. This may lead to differences in results when using apportionment and other geographic layer comparisons. This is because the values for the prior vintage are being applied to a new set of geographic outlines. The Compare with geographies functionality uses the centroid of the analysis area to identify geographies to compare with. Changes to geographies that surround the analysis area might generate different answers and results compared to previous years, which can be confusing.
We recommend that you import and manage custom data for each year in which the geographies are valid. For example, if you have sales figures for 2022 DMAs and want to use them with 2023 demographics, try to find data using 2023 geographies. If these are not available, use your existing data and GeoEnrichment to reapportion the custom data into the new DMAs. Then use the current boundaries for reports and custom data setup until new data, based on current geographies, are available.
How do I migrate my infographics?
Once you have migrated the custom data to the new data vintage, you can migrate your reports and infographics by going to Build infographics and opening your custom template. You will need to confirm that the missing variables are available in and valid for the infographic prior to saving the update. Custom data attributes are not automatically migrated between vintages. Once saved, the template’s metadata will be updated to use the latest vintage of geographic boundaries and data, so that opening the infographic should not produce an error or missing variables when run with this year’s demographics.
I recommend that you download a copy of your infographics prior to making any changes. This will allow you to upload the original should there be any issues, and run the infographic with past vintages of data including the original source geographies. Adding a year to the end of the infographic name should also make it easier to use when switching between years.
What next?
We’re constantly using customer feedback and real-world experiences to improve our software. As more people adopt and use custom data setup, and create infographics from their own data, we will develop more tools to migrate data between vintages. We’re also always expanding our data documentation and providing ever increasing detail on changes. We recommend you check out the What’s New in Demographics article and visit the Learn more section in the demographics reference help to keep up to date with changes.


Article Discussion: