Esri data is organized into groups of variables or statistical measurements connected by a common theme, such as spending behavior or demographic information. Understanding these different groups of data can help you locate what’s pertinent to your work and can lead you to discover data you didn’t even know you needed. This article is part of the blog series Got five minutes? Get to know… and outlines the most important details about Esri Updated Demographics.
- What is it?
- What’s in it?
- What can I do with it?
- Where does it come from?
- Does it change?
- How is it different from other data?
- Where is it?
What is Esri Updated Demographics data?
Esri Updated Demographics provides insights about people in the United States—where they live and work, how they group themselves into households, and information about their race, gender, education, and marital status.
Some of this is similar to the information available from the decennial census produced by the U.S. Census Bureau. However, the decennial census is a public count of people collected once every ten years. The Esri Updated Demographics dataset, on the other hand, is created every year using authoritative public data as well as market data sources to capture recent changes important to decision-makers. This is where the “updated” in Esri Updated Demographics comes from. The dataset also includes five-year projections for select variables, which get updated along with the annual data. A lot can change in a year—especially in areas impacted by natural disasters like floods or wildfires, or in areas experiencing rapid growth.
What will I find in the Esri Updated Demographics dataset?
Esri Updated Demographics includes thousands of variables to help users explore the latest demographic information, spending patterns, and behaviors. These variables cover a wide range of topics, such as: age, population, income, education, home value, households, employment, marital status, net worth, race and Hispanic origin, and generational groups.

Esri Updated Demographic data can be analyzed using standard geographic areas such as census tracts or ZIP Codes, or by custom user-defined geographies such as drive-time areas. Because the boundaries of some geographic areas can change from year to year, Esri provides the vintage of all geographies with every major release. For the most recent boundary information, see United States data.
What can I do with Esri Updated Demographics variables?
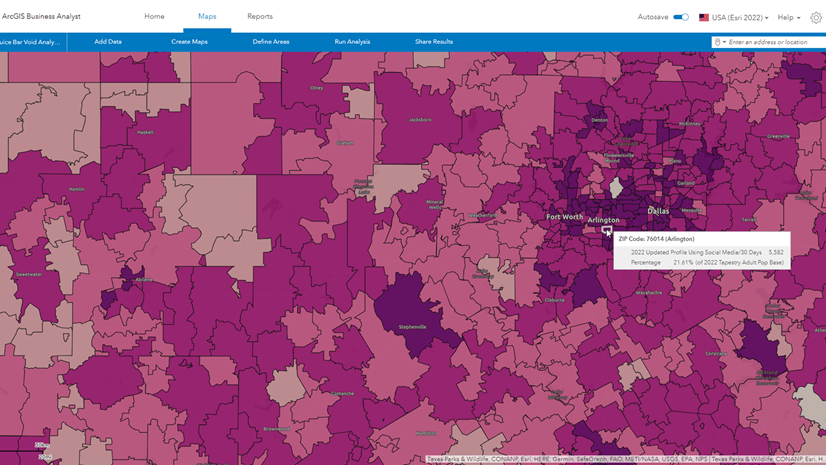
Esri Updated Demographics variables can be used by anyone seeking knowledge about people residing in the United States and their fundamental characteristics. Do you need to understand the age breakdown in an area around a proposed school location? Gain up-to-date insight into local labor markets? Esri Updated Demographics makes this sort of analysis possible. The variables can be incorporated into core ArcGIS capabilities, such as map visualization, spatial aggregation, and pattern analysis.
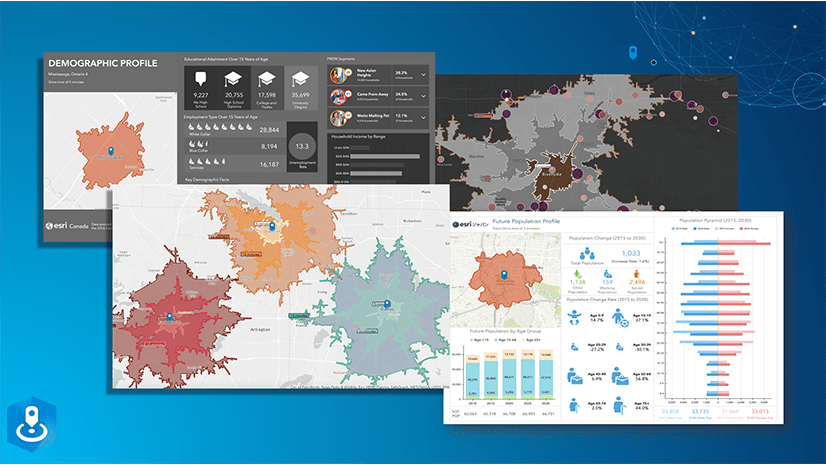
You can also find Esri Updated Demographics variables in ready-made Business Analyst infographic and report templates, such as the Demographic Profile shown below. Or you can build your own infographics and reports to capture exactly the information you need. Reports and infographics are a great way to understand your area!

We have many resources available to help get started with Esri Updated Demographics, such as the Get started with U.S. Updated Demographics tutorial series.
Where does Esri Updated Demographics data come from?
The Esri Updated Demographics dataset gets created every year using both public datasets and market data sources. Our in-house experts employ sophisticated modeling techniques to blend information ranging from population counts, to labor force statistics, to apartment building construction, into an annually refreshed dataset.
Some of the main sources used in the creation of Esri Updated Demographics data include:
- U.S. Census Bureau – Population, housing, and household information
- U.S. Bureau of Labor Statistics – Employment/civilian labor force information
- U.S. Postal Service – Residential delivery statistics
- U.S. Bureau of Economic Analysis – Income information
- Experian – Household and population information
- Zonda – New residential construction (owner-occupied)
- RealPage – Rental properties (multifamily and student apartments)
For more detailed information about how these datasets are built, see Esri Updated Demographics: Related links.
Do the variables included in Esri Updated Demographics change from year to year?
The variables offered in Esri Updated Demographics are largely consistent year over year. Core sets of variables—such as one-year and five-year age groups, household counts, and median household income—are published with each annual release. This way, Esri maintains as much consistency as possible for customers when creating maps, performing analysis, and generating reports and infographics.
Changes do occur sometimes; these might include new income categories or new indexes being added to the collection. Each year, Esri publishes product release notes that identify new, changed, and removed variables.
How is this dataset different from decennial Census data?
Esri Updated Demographics is produced by Esri, providing annual estimates and five-year forecasts of population characteristics. The decennial census is a count of the population, produced by the U.S. Census Bureau every 10 years.
It is important to note that Esri Updated Demographics are available in many U.S. Census geographies. This means a user can view Census decennial values for block groups, tracts, or congressional districts, then access the Esri Updated Demographics estimate for the exact same area.
To demonstrate, the 2020 Census value for total population in Block Group 060590524.252 in Orange County, California is 771.

The Esri Updated Demographics value for the same block group in 2025 shows an increase in the total population to 2,226:

Closer inspection of the aerial view reveals a newly built, bustling housing development. Esri Updated Demographics, refreshed yearly, picks these changes up.

As a point of comparison, in 2022 the population of this same block group was 1,900 and clearing and construction were clearly visible.

Where do I find Esri Updated Demographics variables?
In Business Analyst Web App within the data browser, you can view Esri Updated Demographics variables by setting the Browse by option to Dataset, then clicking Esri Updated Demographics.

Similarly, you can access Esri Updated Demographics data through ArcGIS Business Analyst Pro’s data browser by clicking All Variables, then filtering Dataset for Esri Updated Demographics Only.

Esri Updated Demographics variables are also available in other ArcGIS products, including the ArcGIS GeoEnrichment Service and in ArcGIS Online as premium content. Additionally, here are more ways to access the data, including buying Esri Reports online.
We encourage you to explore the Esri Updated Demographics dataset — you’ll be amazed at the detail and granularity of this data! Keep an eye out for more data-related articles in the Got five minutes? Get to know… blog series.
Note:
This article was originally published on 12/8/2022 and was updated on 1/5/2026 to reflect the latest data source and interface.
This article uses the local and online Esri Updated Demographics dataset from Esri.
This article uses ArcGIS Business Analyst Pro 3.6 and ArcGIS Business Analyst Web App Standard.
Resources
We hope you’ll explore more capabilities in Business Analyst. To continue your Business Analyst journey, visit the following resources:
- Business Analyst product overview page
- Review pricing and purchase Business Analyst
- Business Analyst resources page
- LinkedIn user group
- Business Analyst Web App video channel
- Business Analyst Pro video channel
- Business Analyst on Esri Community
- Business Analyst Web App login page
- Email the team: businessanalyst@esri.com


Article Discussion: