The biggest data update is finally here!
The biggest data update for ArcGIS Business Analyst Web App and ArcGIS Business Analyst Mobile App is here! For the first time ever, you have access to not only the new, current-year Esri Updated demographics data but also the previous year’s U.S. demographics data. But wait, it doesn’t stop there–you’ve also got access to global places/points of interest (POI) data for both business and nonbusiness POI categories for every country! Is this not the biggest data update you’ve ever seen?

In this blog article, we take a deep dive into the types of data available, how to use the data, how to combine your own data with Esri’s data, and go over use cases to help you better interpret the information.
The samples we cover are just hypothetical scenarios for learning purposes to help you see the endless solutions and possibilities with ArcGIS Business Analyst. If you’d like to learn more or want to try ArcGIS Business Analyst Web App, sign up for a free 21-day trial.
2022/2027 Esri Demographics Data
The 2022/2027 Esri Updated Demographics data captures the most accurate current-year estimates and five-year projections for more than two thousand demographic and socioeconomic characteristics. With this data, you gain insight on interesting trends and forecasts for population growth, income, age, diversity, housing, and much more. Demographic data allows you to analyze and rank locations based on the most up-to-date market information and communicate your knowledge in the form of infographics and reports. Check out our ‘Get started with demographics’ guided learn lesson to understand, interpret, and use demographics data.
Find the best location using Esri demographic data:

Let’s say you’re a bank that is looking to increase ATM usage, therefore you want to determine how close your ATMs are to customers as well as other competitor ATMs. You started by mapping all your ATM locations in ArcGIS Business Analyst, but you’re uncertain what the next step is. Begin by selecting the Suitability Analysis workflow and add variables that will show you how suitable each location is based on surrounding demographics, businesses, and competition—such as ‘total population’, ‘total employed population age 15 years or older’, ‘nearby shopping centers/malls’, ‘income’ and ‘nearby ATMs’. Refine the variable weights based on proximity to your target demographic and distance from other ATM locations. Once the map is created, you can analyze the results, view the site rankings, understand where your competitors are located, and increase opportunities. You can even run ready-to-use infographics to learn more about the market within a certain walk-time or drive-time from your locations.
Censuses 2020, 2010, and 2000 Data
U.S. Census data is updated every ten years and it’s finally here! Census data is the best source for a complete count of population and housing data down to the block level. This data helps you gain a better understanding of an area’s demographics and how resources and communities will be distributed over the next ten years. For the first time ever, you have access to data from Censuses 2020, 2010 and 2000, allowing you to easily compare past census measures. To learn more about what’s new in Census 2020 data, read our ‘Census 2020 redistricting data now available in ArcGIS Business Analyst’ blog article.
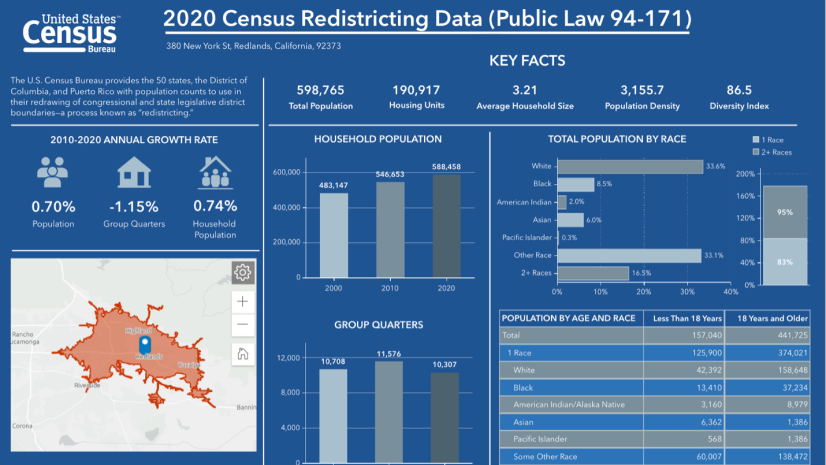
Determine if a new community has growth potential with Census 2020 data:

Picture this: you’re a real estate developer and want to plan for a new community in Winchester, California. Prior to allocating time and resources to complete a due-diligence site report, you first want to ensure there are growth opportunities. Locate Winchester, CA on the map and set a defined drive-time area around the location. Once set, run the 2020 Census Redistricting Data infographic and Community Profile infographic. This will provide you with the up-to-date information you need including annual growth rate, household population, average household size, mortgage as a percentage of salary and whether there is demand or not. Want to take a deeper dive? Hover over the information to explore for more details. You now have a better understanding of the community and can start planning ahead.
American Community Survey (ACS) 2016-2020 data
American Community Survey (ACS) data consists of new data every year that helps users understand the continuing changes taking place in their communities and plan for the future. It consists of a plethora of variables regarding housing, income, work, internet access, education, disability, and health insurance. This data is broken up into states, counties, and census tracts. To learn more, read our ‘2016-2020 ACS release includes important updates to Census boundaries’ blog article.
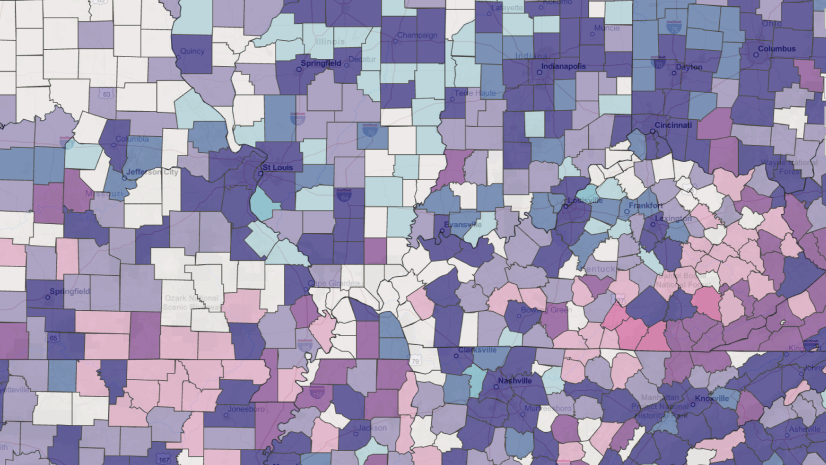
Create targeted and informed strategies with ACS data:

If you’re looking to create online promotions to increase your sales, you might want to use ACS data. Imagine you are looking to do an online promotion for Veterans Day, but you don’t know where your target audience is located. Click the Color-Coded Map workflow and browse for the ‘Veteran Status and Military Service’ variable. This data is categorized by age, sex, service location and year in service. Click the variable that applies to your promotion and run the workflow. You are now able to see where the majority of your targeted audience is located down to the block level. Now that you know where to reach your target audience, put your creative cap on and shift your focus to your campaigns.
2022 Tapestry Segmentation data
Tapestry Segmentation data includes yearly updated lifestyle and population-based data addressing demographic shifts over the last decades and the emergence of new markets. This data breaks U.S. neighborhoods into 67 unique segments helping you understand your audiences’ needs, demographics, and socioeconomic characteristics. For a broader scope of the market, segments are summarized by 14 LifeMode and 6 Urbanization groups. With Tapestry Segmentation data, you can understand valuable information about people and trend changes, giving you the ability to make accurate and quick decisions! Read our ‘Esri Data 101: Tapestry Segmentation’ blog article to learn more.
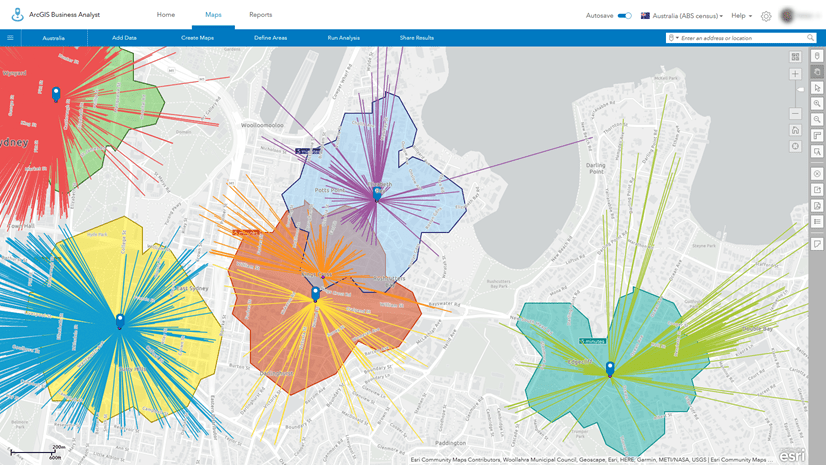
Start your site selection process for a potential business location with Tapestry Segmentation data:

Imagine you own a successful organic grocery store and are looking to expand to Massachusetts. You’re aware that your target audience usually belongs to the Principal Urban Center group, which includes consumers who are young, well-educated, health-conscious, and care about the food they eat. You’ve narrowed down your selection to five neighboring cities but have no idea where to go from here. Start off by using the Find Location tool to enter the potential cities you have in mind, then add drive times of 5, 10, and 15 minutes around each location. To help you rank the most suitable location, use the Suitability Analysis workflow, and select the following variables: ‘2021 Principal Urban Center Tapestry Group’, ‘Total Population’, ‘2021 Regularly Eat Organic Foods’, ‘2021 Buy Foods Specifically Labelled: Natural / Organic’, ‘2021 Used Organic Foods.’ You can now refine and weight your selected variables based on their importance. The results will determine the best location that meets the criteria you defined. You can even select the top-ranked location and use the Tapestry Profile infographic to see a vivid picture of the people and types of households in the area, helping you in your decision-making process.
2022/2027 Consumer Spending data
The updated Consumer Spending data captures the current-year and five-year forecast data. Consumer Spending data provides information on what products and services consumers are spending on, the total expenditures, average spending per household, and a Spending Potential Index (SPI) in multiple categories. This data helps you understand who your customers are, how they spend their money, and how to find more customers with similar preferences. Read our ‘Esri Data 101: Consumer Spending’ blog article to learn more.
Maximize your company’s effectiveness and resources with Consumer Spending data:

Let’s say you’re a non-profit organization looking to send your representatives to different areas with the goal of collecting contributions. You want to define areas that are highly populated, have a large amount of disposable income, and individuals who contribute to charity. Start by using the Smart Map Search workflow and select the following variables: ‘2021 Total Population’, ‘2021 Average Disposable Income’, and ‘2021 Cash Gifts to Charities’, ‘2021 Cash to Churches/Religious Orgs’, ‘2021 Cash to Educational Institutions’. Once selected, filter your ranges and locate your desired target audience. After you locate the areas that match your criteria, dig deeper using the Color-Coded Maps workflow to locate the exact block levels with the highest likelihood to contribute.
2022 Market Potential data
Are you ready for a new addition of 700 Esri Market Potential data and psychographic variables? The Market Potential data provides unparalleled insight into how people think, what they value, how they spend their time, and how this varies spatially across the country. The data includes MPI (Market Potential Index) for products or services comparing the demand in a specific area compared to the national demand for that product or service. If the value is greater than 100 in that area, there is higher demand for that product or service. On the opposite side, if the value is less than 100, there is lower demand. Read our ‘How to use and interpret Esri’s US Market Potential Data’ StoryMap.
Take advantage of sales opportunities with Market Potential data:

You have a hair salon company and want to mail promotional coupons that will drive more traffic to your store. You create the perfect postcard and are just about to head to the delivery service to send your coupons to all local ZIP codes. What if I told you that you can save your marketing money by sending the cards to the individuals most likely to use your coupons. Don’t believe me? Begin by running the Smart Map Search workflow using the following variables: ‘2021 Female Population’, ‘Use Professional Service for Hair Color / Highlights Last 6 Mo’, ‘Use Professional Service for Haircut Last 6 Mo’, and ‘Purchased Product at Salon or Day Spa Last 6 Mo’. Based on your hair salon location, locate your target audience within surrounding cities. Pinpoint those cities and create a color-coded map to find the exact ZIP codes where your target audience is located. Don’t stop there: combine Market Potential data with Consumer Spending data to locate consumers that are most likely to use coupons as well as determine which hair products are currently in demand. With all this information, you can create and send a special bundle promotion that your target audience won’t be able to ignore.
2022 Business Summary data
The Business Summary data includes statistics on more than 13 million U.S. businesses providing you with number of businesses by industry, total sales, and total number of employees. This data helps organizations with understanding the competitive landscape and whether an organization can increase their market share, determining if there are any gaps.
Determine an area’s economic development with Business Summary data:

If you’re promoting economic development within a specific geographical area, then Business Summary data is perfect for you. Let’s say your goal is to maintain a high-quality workforce and attract new businesses, in addition to retaining and expanding the current businesses in a certain region. Start by using the Find Location tool to locate the area, then add rings according to the distance of the market you want to cover. Once set, you can create customized reports combining the ready-to-use Business Summary Report, Market Profile Report, Civilian Labor Profile and more. While reviewing these reports, you notice that there’s a surplus of businesses in the automotive industry but at the same time there aren’t enough complimentary businesses around it such as car washes or repair shops. Using ArcGIS Business Analyst tools, you can continue your analysis to plan for market growth based on demand in the area.
Global Places/Points of Interest data:
We have expanded the reach of our points of interest data (previously known as Business and Facilities Search) globally! You’ve heard it right, this data is available in every country and region in ArcGIS Business Analyst. Points of Interest data consists of With POI data, you can search for specific businesses and facilities, plan for future expansions, and complete competitive analyses.
Complete your competitive analysis research with Points of Interest data:

Imagine you own a well-known ice-cream business, and you want to open a few new locations by next summer. Start your analysis today by assessing the overall competitive market in your desired locations. One of the first things you need to determine is whether there is potential for growth or if the current area is already saturated. Use the Points of Interest Search workflow and filter to ‘Ice Cream Parlors’. Look at that—it populates a full list of all small, mid-sized, and large ice cream shops in that area. You can refine your search to filter to your direct competitors, cities, ZIP codes, square footage, number of employees, and sales volume. Once you filter it to your liking, run the Points of Interest workflow which informs you where your competitors are located and the size of their business. You can now locate an area that hasn’t been tapped into and start your site location analysis process. Make sure to use our plethora of infographics, reports, and workflows to determine if that is the best location for your target audience.
Other Global Data Updates
Africa
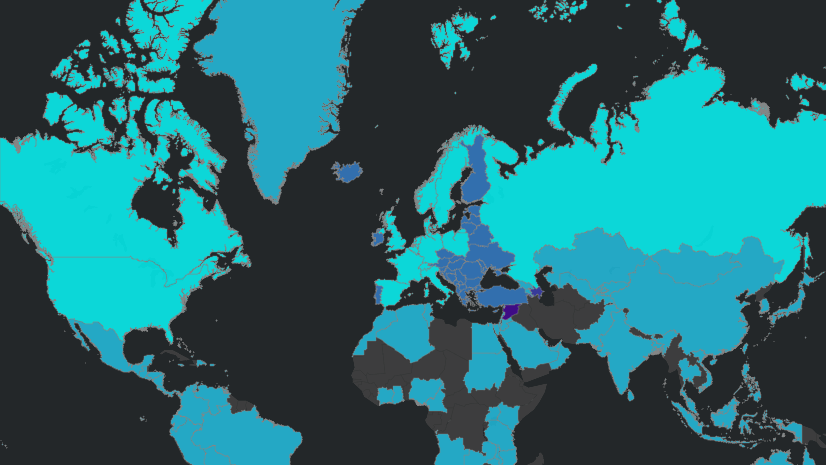
- Expanding demographic coverage in Africa by adding data for 22 additional countries:
Benin, Burkina Faso, Burundi, Cabo Verde, Central African Republic, Chad, Republic of the Congo, Equatorial Guinea, Ethiopia, Gabon, Gambia, Guinea, Guinea-Bissau, Liberia, Madagascar, Mali, Mauritania, Mayotte, Niger, Senegal, Sierra Leone, Togo, Zimbabwe
Eastern Europe
Albania, Andorra, Belarus, Bosnia and Herzegovina, Bulgaria, Croatia, Cyprus (Greek Part), Czech Republic, Estonia, Faroe Islands, Greenland, Hungary, Iceland, Kosovo, Latvia, Lithuania, Malta, Moldova (without Transnistria),, Monaco, Montenegro, North Macedonia, Romania, Serbia, Slovakia, Slovenia, Ukraine
Additional Resources
We hope you enjoyed reading through this blog article. Please remember, ArcGIS Business Analyst is not limited to the scenarios we mentioned above. We have companies of all sizes in different industries using our demographic mapping software to perform location analytics. Do you want to share how your company is using ArcGIS Business Analyst? If so, please email us at businessanalyst@esri.com, we can’t wait to hear about it!
Below we’ve added resources to help you with your ArcGIS Business Analyst journey:
- Migrate your custom Business Analyst content to 2022 Esri Demographics
- Business Analyst product overview page
- Review pricing and purchase Business Analyst
- Join our LinkedIn Business Analyst User Group
- Join our Business Analyst Esri Community
- Read more Business Analyst blog articles on ArcGIS Blog
- Watch Business Analyst Web App videos
- Watch Business Analyst Mobile App videos
- Visit the Business Analyst Resources page
- Read ‘What’s in Esri U.S. Demographics (June 2022)’ blog article
- Esri 2022 U.S. Demographics Release Notes


Article Discussion: