When using ArcGIS for Excel, part of ArcGIS for Microsoft 365, you can add valuable context to your own data by enhancing it with authoritative content from ArcGIS Living Atlas of the World.
With a few steps, you can create a map that combines your Microsoft Excel spreadsheet data with information from ArcGIS Living Atlas about the surrounding people, housing, infrastructure, environment, and more. You can use the map to help visualize the data and answer questions.
For example, imagine you’d like to invest in residential property in Houston, Texas. You have a table of candidates based on price, square footage, and other data you collected from real estate websites. To help you decide which property to buy, you also want to know the median home value of the neighborhood and flood risk. You can get this data from ArcGIS Living Atlas by following the steps below.
Step 1: Open your spreadsheet in Microsoft Excel and click the ArcGIS tab.

To create maps in Excel, you’ll need Microsoft 365, ArcGIS for Excel, and privileges in ArcGIS Online or ArcGIS Enterprise to create content. See ArcGIS for Excel help documentation for more information.
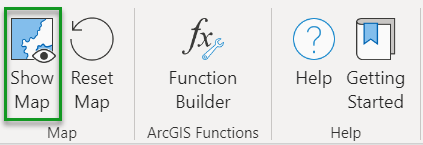
Step 2: On the ArcGIS ribbon, click Show Map and sign in with your ArcGIS account.
Step 3: In the Layers pane, click Add from Excel.
ArcGIS for Excel automatically populates the Dataset field with the first Excel table in the worksheet.
Step 4: If necessary, click Select a cell range in the Dataset drop-down menu.
Step 5: Choose an appropriate location type and match the fields in your worksheet to the fields in the Add from Excel pane. For example, if your data contains latitude and longitude values, select Coordinates and match Longitude and Latitude to the appropriate columns in your spreadsheet.
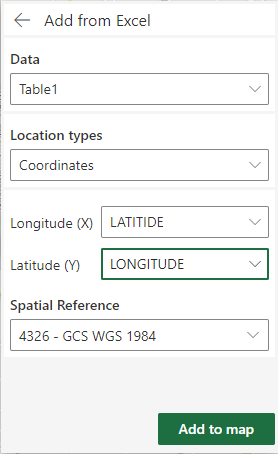
Step 6: Click Add to map.
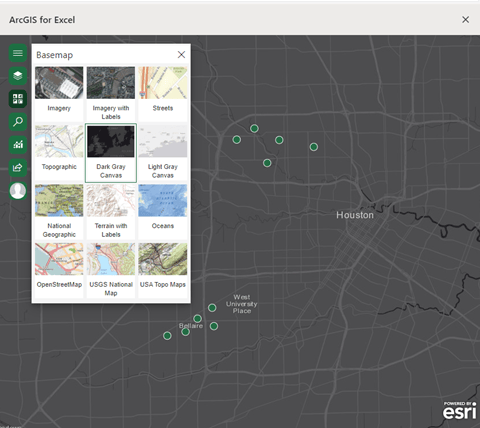
Your data appears on the map, and the data you added is listed in the layer list. Each location in your worksheet is represented by a single symbol on the map.
Step 7: Change the basemap to Dark Gray Canvas so your property symbols stand out.
Now you’ll add the demographics layers from ArcGIS Living Atlas.
Step 8: Click Layers to open the layer list, and click Add from ArcGIS.
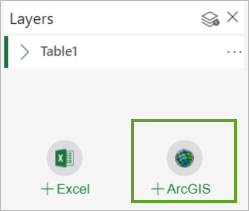
Step 9: In the Add from ArcGIS drop-down menu, choose Living Atlas.
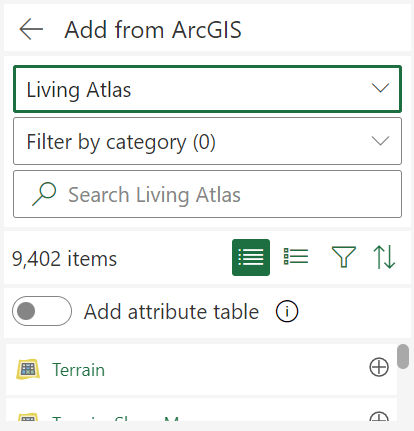
The gallery updates to show data in ArcGIS Living Atlas. You can sort results by date, title, view count, or owner, or you can filter results to only show items in specific categories or regions, or by type, tags, or status. In this case, you’ll search for the item using the Search field.
Step 10: In the Search field, type Esri Updated Demographics Variables and click the Add button next to the Esri Updated Demographics Variables layer.
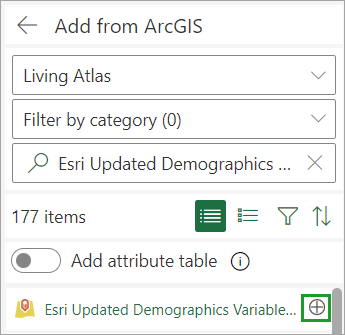
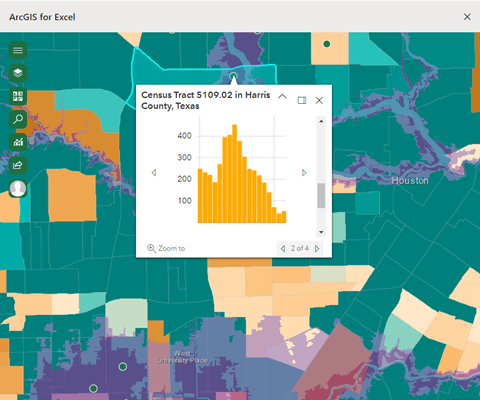
Demographic data is added to your map.
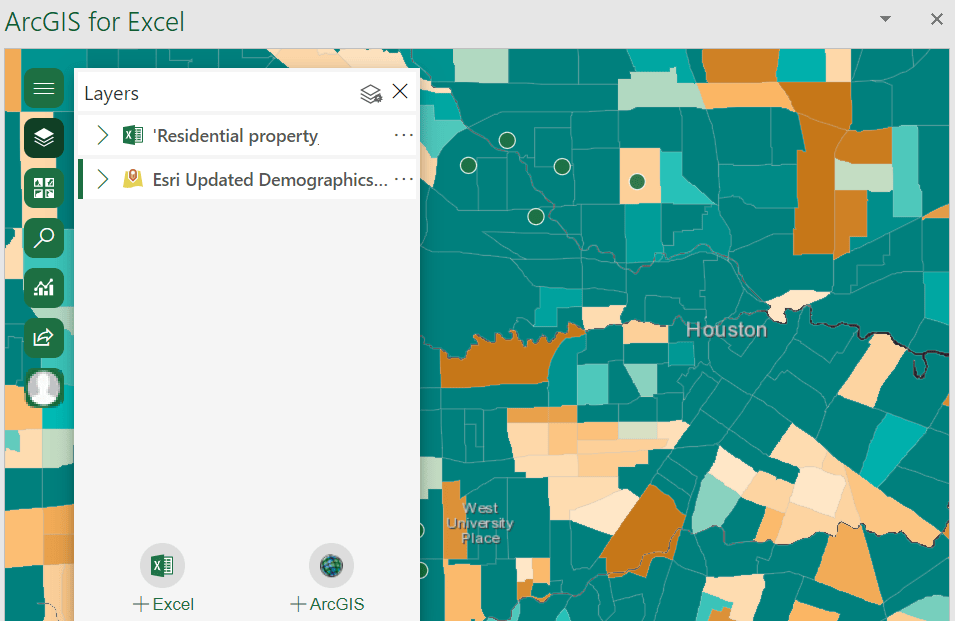
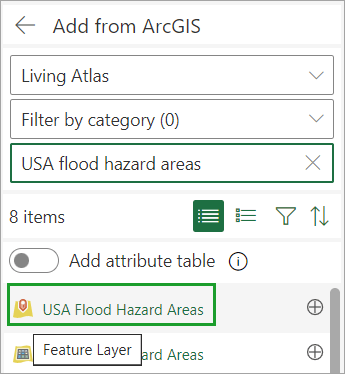
You also want to see flood risk data from ArcGIS Living Atlas. Again, you’ll find it through a targeted search.
Step 11: In the Living Atlas search box, type USA flood hazard areas and add the USA Flood Hazard Areas feature layer to the map.
Step 12: On the map, zoom in to view the area surrounding a potential investment property.
Now you can explore the data in the map to decide which property is the best investment. You see one in an area with high home values and low flood risk. That looks like a good choice.
More information about ArcGIS for Microsoft 365, ArcGIS for Living Atlas of the World, and demographic data
Get started with ArcGIS for Excel (help topic)
Try ArcGIS for Microsoft 365 (tutorial series)
Encore ArcGIS: One minute demonstration of ArcGIS for Microsoft 365 at 2023 Esri UC plenary (video)
Get started with ArcGIS Living Atlas of the World (tutorial)
Learn essential demographic data skills (tutorial series)
This article was originally published on November 5, 2018 and has been updated.


Article Discussion: