ArcGIS Online helps you understand the world around you by using interactive maps to connect people, locations, and data. You get smart, data-driven visualizations and intuitive analysis tools that deliver location intelligence. This intelligence can then be easily shared as a map, story, dashboard, or app with your organization or the world. ArcGIS Online can help you scale the reach of the work done in ArcGIS Pro, and also work alongside an ArcGIS Enterprise deployment.
The February 2026 update includes new features and enhancements for smarter content management, richer data and imagery options, streamlined workflows, and more dynamic mapping and sharing capabilities.. Highlights of these updates, along with other enhancements and new functionality throughout ArcGIS Online, are provided below.
ArcGIS Online is updated three times each year. See the ArcGIS Online blog articles to learn more about previous updates to ArcGIS Online and new functionality and enhancements you may have overlooked.
For more information and additional details about this release, see the What’s new help topic or view all posts related to this release.
Don’t have time to read the blog article? View the video instead.
Quick links
Use the links below to jump to sections of interest.
App Builders
Apps and Extensions
- ArcGIS Hub
- ArcGIS Web Editor
- ArcGIS Notebooks
- ArcGIS Data Pipelines
- ArcGIS Velocity
- ArcGIS Workflow Manager
- ArcGIS Solutions
Ready-To-Use Content
Map Viewer
Using Map Viewer, you can author, explore, edit, and share web maps. Map Viewer is used to perform common GIS tasks, such as to explore the contents of a web map, change the basemap, add data layers and styles, perform measurements, and execute different types of data analyses. Map Viewer features responsive mapping and supports real-time updates to the map as you work.
Here’s an overview of new features and enhancements to Map Viewer delivered with this update.
Enhanced style capabilities
Map Viewer allows you to explore data using a variety of smart mapping styles and symbols. When you style map layers in Map Viewer, the nature of the data determines the default styling options. You can experiment with graphic elements such as symbols, color ramps, and line weights, as well as rotation, classification, and themes, and instantly see your choices reflected on the map. With this update, the following enhancements have been delivered.
Custom animations
Animations make maps more intuitive and visually engaging by helping users emphasize trends, changes, and critical information so key details stand out without distracting from the rest of the map. Prior to this update, authors were limited to choosing from a set of pre-designed animated symbols. Now, with custom symbol animation, users can animate any vector symbol and control which parts of the symbol move.

You can add movement to points, lines, and polygons with animated effects like offset, rotation, scale, and size. Open the Styles pane, choose your symbol, and configure the animation to create a new, dynamic effect.
Offset effects
You can also now add the offset effect property to any vector line or vector polygon symbol without first enabling the property on the symbol in ArcGIS Pro. For more information, see Use style options.
Dynamic centroid placement for polygon labels
Labels now dynamically reposition within the shape, ensuring they remain on-screen, easy to read at all scales and keep polygon labels visible while panning and zooming. This improvement reduces the need to manually adjust views, speeds up feature identification, and makes complex maps easier to interpret.
Improved attachment handling
Previously, viewing an attachment meant leaving the map and opening a new tab. Now, attachments open within the map interface, with the option to expand to full screen, eliminating the need to navigate away from current workflows. Image attachments will open in a full-page window, making it easier to view the content. Also, you can now view related photos and files directly in the attribute table and maximize them for full-page viewing.

Set visible time ranges for layers
You can now enable time-based layer visibility to display a layer only for a specific time period. You can control when layers appear on a map by defining a visibility time range, for example showing one layer from 2020 and another from 2021. This is done by enabling the Layer visibility period setting in the layer properties, then using the time slider to view different layers across time, even if those layers don’t contain time-enabled data. This works with all layer types, including sketch and group layers, making it easier to create more dynamic and flexible maps.

True curve support
Previously, curved features drawn in ArcGIS Pro or Map Viewer were converted into a series of straight-line segments. With true curve support, curves are now preserved as smooth and round, exactly as they were drawn. This improvement ensures greater geometric accuracy, which is critical for precise measurements, snapping, and other workflows that depend on accurate representation of curved features.
You can now create and edit true curves using drawing tools in Map Viewer. Additionally, you can switch between drawing tools when creating and editing features.

Editing templates
Feature templates define categories of items that editors are allowed to add to a feature layer based on specific combinations of attributes. For example, feature templates for a schools feature layer might allow editors to choose whether a new feature should be classified as an elementary school, middle school, or high school. When working with editing templates in Map Viewer, you can now use shared (group and preset) editing templates created in ArcGIS Pro.
Calendar heat charts
Calendar heat charts are now available to visualize patterns in temporal data by aggregating incidents into a calendar grid. Calendar grids can be configured to display temporal patterns across the months in a year or across the days in a week. The calendar heat chart below identifies patterns in car accidents based on the day of the month.

Arcade support for hosted imagery layers
Arcade is now supported for hosted imagery layers, enabling you to configure pop-ups that provide meaning and context to imagery layers using two new profiles: imagery pop-up and imagery pop-up elements. Imagery services now support both attribute expressions and Arcade elements for pop-ups.

See the ArcGIS Arcade release notes for information about new and improved functionality in the latest Arcade releases.
Improved oriented imagery support
When working with oriented imagery, the new Search tools capability allows you to perform different types of image searches within the map, including Explore Images, Explore Images 3D, and Display Images. You can filter by time-based characteristics when searching for images. The oriented imagery viewer also now opens in the center of the Map Viewer window, improving accessibility and providing a more consistent viewing experience.
Imagery in ArcGIS Online
Imagery in ArcGIS Online makes it easy to host, explore, analyze, and share imagery at scale-without standing up or maintaining your own infrastructure. From simple visualization to advanced analytics and deep learning, organizations can turn imagery into actionable insights using a secure, fully managed SaaS environment. Once imagery is organized and published, teams across the organization can use it in maps, apps, and analysis workflows to support faster, more informed decisions.
Unlock deeper climate insights with expanded hyperspectral support. Hyper-spectral imagery is a type of data that captures hundreds of spectral bands, revealing information invisible to the human eye, like mineral composition, vegetation health, and water quality. ArcGIS Online now supports two additional hyperspectral data types, AVIRIS and EMIT, building on existing hyperspectral imagery support. Users can host and manage these datasets to leverage unique spectral signatures that support applications involving climate prediction and impact assessment.
For all the details, see What’s new in imagery in ArcGIS Online.
Routing and directions enhancements
Routing and directions have been enhanced with the addition of interactive waypoint drag and drop capabilities. Selecting the Edit route button now allows you to add, move, and remove waypoints. Click any waypoint to drag it to a new location and the route will be solved again. These new capabilities enable a new route to be automatically calculated based on the updated waypoint locations. For more information, see Get directions or Create route layers.

What’s Here? custom geocoder support
When you right click on the map, a What’s here? appears and you can reverse geocode to return results for that location. Previously, only the default World Geocoder was enabled for reverse geocoding. With this update. you can now configure new or existing locators for reverse geocoding. In addition, an Add to sketch button has been added to the pop-up. See Find addresses and location coordinates for more information.

Visualization tab for map image layer items
Previously the Visualization tab has only been available for feature layer items. The Visualization tab has now been enabled for map image layer items. Use this tab to explore the layer and modify any layer configurations such as effects, popups, and style.
Map only URL parameter
Append the URL parameter &mapOnly=true after the map ID to share a link to open the map with a minimal interface, hiding the Contents (dark) and Settings (light) toolbars. This URL parameter has previously been only supported in Map Viewer Classic, but has now been added to Map Viewer. If the URL parameter is set it to true, it opens the web map with all the toolbars hidden, maximizing the map area that viewers can work with and allowing the map to be the focus. Click Show interface to go to the default Map Viewer configuration.
Map printing enhancements
Printing in Map Viewer now supports a dynamic legend, showing only the legend for features visible in the current map extent in the printed layout. This is enabled by default and can be managed in the Advanced options section of the Print pane. You can also now choose your preferred scale bar unit, allowing you to include a reference scale that is more relevant to the map scale.
Include a basemap gallery when embedding or sharing a custom link
When embedding a map or creating a custom link to a map, you can now include a basemap gallery as a map element. You can also now view the map time zone.
Map Viewer Classic is retired
This release marks the official retirement of Map Viewer Classic in ArcGIS Online. Moving forward, Map Viewer Classic has been removed from the app launcher and item details page, and can no longer be configured as the Primary Map Viewer. To ensure a smooth transition, all existing Map Viewer Classic links, including URL parameters, will now automatically redirect to open in Map Viewer. This allows you to take full advantage of enhanced performance, advanced styling, and the latest mapping capabilities without losing access to our existing work.
See Map Viewer Classic roadmap for retirement for more information.
Other improvements
Field value formatting when configuring cluster fields and configuring bin fields has been updated to better align with internationalization standards, which offers improved locale support for date and number fields and introduces new formatting options.
Image caching is now enabled during directional and sequential navigation, reducing load times and improving overall viewer performance.
For more information, see What’s new in Map Viewer.
Analysis in Map Viewer
Map Viewer’s spatial analysis tools allow you to quantify patterns and understand relationships in your data. Feature and raster analysis tools and raster functions are available to all members with the appropriate privileges.
ArcGIS Living Atlas imagery layers for analysis
Select Living Atlas imagery layers have been optimized for analysis. The spatial extent for analysis has been expanded to state-wide, country-wide, or even global scale, and these layers can be used in conjunction with one another for multisource analysis. Imagery layers optimized for analysis simplify data discovery and accessibility, shifting the focus from data management to extracting actionable insights at scale with workflows such as change detection, land cover classification, urban heat analysis, and more.
The full collection of optimized layers can be found in the Living Atlas Imagery Layers Optimized for Analysis group. You can also use search on the Living Atlas Browse tab to return the same list of optimized layers. For more information, see ArcGIS Living Atlas ready-to-use imagery layers for analysis.
New and updated analysis tools
New analysis tools:
The Geomorphon Landforms raster analysis tool calculates the geomorphon pattern of each cell of an input surface raster and classifies them into common landform types.
The Summarize Categorical Raster raster analysis tool generates a table containing the pixel count for each category in each slice of an input multidimensional categorical raster.
The Label Bad Bands raster function enables you to specify a set of bands using ranges or lists to be labeled as bad.
The Subset Bands raster function enables you to extract a subset of bands using ranges or lists.
Updated analysis tools:
The Enrich Layer tool now includes a Travel direction parameter when a travel mode is used to generate enrichment areas. Choosing the travel direction is important when generating travel areas because of road network restrictions like one-way streets.
The Enable accelerated analysis environment setting is now available in beta for the Classify Pixels Using Deep Learning and Detect Objects Using Deep Learning raster analysis tools. This setting enables high-speed and adaptive processing by assigning computation resources based on the type of analysis and the size of the job.
Plan Routes and Calculate Travel Cost now support the Processing extent environment setting.
ModelBuilder
ModelBuilder is an interactive canvas for building analysis workflows using the analysis tools available in Map Viewer. Models are created by chaining together data and analysis tools into workflows, where the output of one tool becomes the input for another tool. These workflows can range from routine data management tasks to complex spatial analysis. With ModelBuilder, users can design, execute, and share complex multi-step analysis workflows—entirely within a browser and without writing a single line of code.
With this update, users can now create and share custom ModelBuilder workflows as web tools that can be used in Map Viewer, ArcGIS Experience Builder, and other custom web applications. This capability enables advanced users to share their custom workflows with a broader audience without the need for additional guidance.
For example, a city planner designs a workflow in ModelBuilder that automates the analysis of proposed development sites, combining zoning data, flood risk, and traffic impact. By sharing it as a web tool, other staff and stakeholders can run the analysis directly in their browser without needing step-by-step instructions. This streamlines decision-making and ensures consistent, repeatable results across teams. For more information see, Publish your ModelBuilder models as web tools.
Other ModelBuilder enhancements:
Plan Routes is now supported in ModelBuilder as a premium tool.
Analysis models now support the following value variables: areal unit, Boolean, time unit, and enrichment variables. Variables are inputs to an analysis tool that hold a value or reference to data and can make iterating on tool parameters faster. Variables are also essential for configuring an analysis model to be published as a custom web tool.

Scene Viewer
Scene Viewer is ArcGIS’s dedicated web app for visualizing geospatial data in 3D, from local web scenes to large-scale digital twins. With this update, Scene Viewer has been enhanced with new capabilities and features, including the following:
Google Photorealistic 3D basemaps (beta)
With this update, users can create web scenes that incorporate Google Photo Realistic 3D basemaps (beta). Two Google 3D basemaps are now available: Photorealistic and Photorealistic Hybrid. By leveraging these new basemaps, organizations can explore buildings and environments from multiple angles with accuracy and realism.

Administrators and those with sufficient privileges can turn on the Allow members to use Google Photorealistic 3D basemap toggle button in the scene item settings. When enabled, the basemaps are available in the Scene Viewer basemap gallery. See Google Photorealistic 3D basemaps (beta) for more information.
Gaussian splat layers
Gaussian splat layers are now supported in Scene Viewer, bringing high -fidelity, photorealistic 3D visualizations to ArcGIS web workflows. Created from drone and aerial imagery in ArcGIS reality applications, splat layers use dense visual data to visualize rich detail across infrastructure, vegetation, and urban environments and can preserve fine details like wires, pipes, and narrow structural elements seen in complex environments such as factories and substations. For more information, see the Help documentation.

Other enhancements
Use ArcGIS Arcade expressions for your layer visualizations.
Browse and add layers from favorited ArcGIS Hub catalogs.
For more information, see What’s new in Scene Viewer.
Content management
Item details assistant (beta)
Metadata, information about your content, is essential for making geospatial data reusable, discoverable, and AI-ready. The Item Details assistant (beta) uses generative AI to help you quickly create or improve an item’s title, summary, description, and tags. In the Review Suggested Item Information dialog window, make sure to review and edit the suggestions to ensure the metadata accurately reflects the content. After saving the changes, you’ll see the new metadata reflected on the item page.
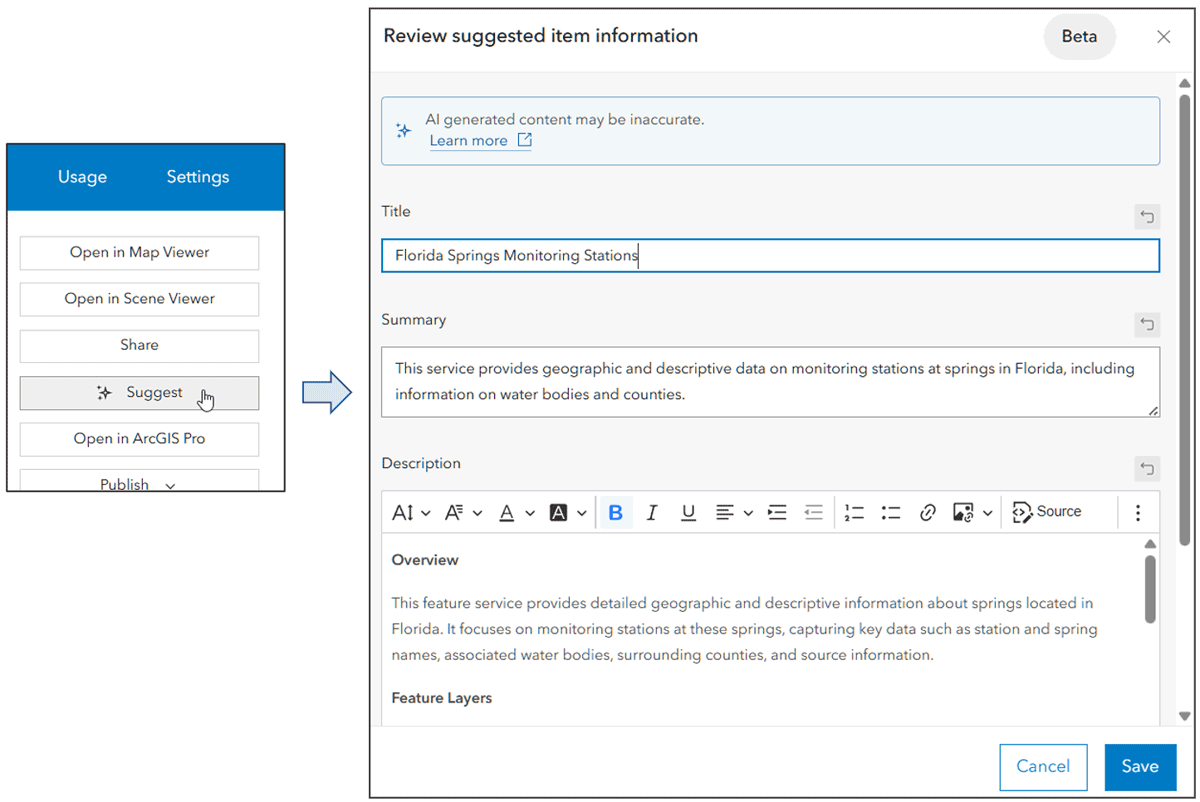
The assistant also suggests attribute field information, so you can create and enhance the field display name, description, and value type. Attribute field information is especially helpful for making your data more understandable and ready for emerging AI applications. The Item Details assistant is available as a beta feature in ArcGIS Online and ArcGIS Enterprise.
View map and scene item dependencies
View item dependencies in an Items used section on the item page Overview tab for maps and scenes. The Items used tab displays all layers that are in the map or scene, enabling you to understand the component items used.

Designate replacement items
You can designate replacement items on deprecated or retired items. If you set a replacement for retired ArcGIS Configurable Apps or Classic Esri Story Maps, websites that consume them will be redirected to the replacement item automatically. Users who find one of these items in the organization will see a badge indicating that a different item should be used instead.
Other updates and enhancements
You can use a hosted feature layer or table to add rows or update rows in another hosted feature layer or table. For more information, see Update your data using an existing feature service.
When you create an empty 3D object layer from the Content page, you can define what fields are present.
You can add a geospatial PDF as an item and designate it for use in ArcGIS Field Maps.
You can add an Esri Spectral Library (.esl) file as an item and share it to allow other users to download it for use in hyperspectral imagery analysis in other clients.
Two new raster types are supported when you create a hosted imagery layer: AVIRIS and EMIT.
Accounts and administration
Manage AI access with role-based access and administrative control
Organization management enhancements include new role-based privileges for AI assistants, giving administrators greater control over how generative AI capabilities are adopted across their organization. Administrators can now specify who can access AI assistants using a custom role. These controls can help organizations align with organizational policies and compliance requirements. See the the AI section for more information.
Credit management dashboard (beta)
Organization administrators and members with a custom role with the privilege to view subscription status reports can use the newly designed dashboard (beta) to view and track credit consumption across your organization. Expanded credit reporting now provides deeper visibility into usage, including credits consumed for storage (by item type and by individual members), credits usage for specific transactions such as geocoding and geoenrichment, and detailed breakdowns of session-based credit usage by session type and by member.
")
These enhancements give administrators the insight needed to better monitor, manage, and optimize organizational credit usage. For more information, see Announcing the new credit management dashboard (beta).
Over-assigned user type messaging improvements
Improvements to over-assigned user type messaging streamline license management and reduce administrative friction. The over-assignment message now persists as a banner across key Organization pages, including Overview, Members, and Licenses, ensuring issues remain visible until resolved. Administrators can manage user types directly from a window launched from the banner, eliminating unnecessary page navigation. The window is available to any user with permissions to manage licenses for all members, and enhanced app filters now allow administrators to quickly identify members based on their access to ArcGIS Pro license levels.
New SAML certificate management (beta)
A new SAML certificate workflow is introduced providing a more secure, flexible, and efficient management experience. Available in beta, the updated workflow gives organizations greater control through options to apply their own certificates or generate self-signed certificates, along with automated notifications that alert designated administrators before certificates expire. Organizations that are not ready to adopt the new workflow can evaluate it in a free trial organization without affecting existing settings, making this an ideal time to review and confirm administrator contact information.
Other improvements
New controls allow administrators to require email verification before members update their email addresses.
Organizations can rotate their custom or self-signed keys and certs without downtime.
AI
With this update, we’ve introduced new AI assistant experiences and enhancements across ArcGIS. These updates bring new ways for users to interact with GIS tools and workflows directly within the products they already use. By offering contextual, natural language guidance, assistants help users move forward when choosing tools, generating code, troubleshooting workflows, or learning as they work. ArcGIS Online users can enable these experiences for their organization, explore how they fit into existing workflows, and share feedback as they use them.
New role-based access to assistants
To support confident adoption, this update introduces a new role‑based privilege for AI assistants, giving administrators direct control over who can use assistants within their organization.
In ArcGIS, roles define the privileges and permissions that determine what members can do with content, maps, and applications. With this new privilege, administrators can specify which custom roles have access to AI assistants, making it possible to progressively roll out these capabilities while aligning usage with internal policies and compliance requirements.
For a deeper look at what’s included in this update, see What’s new in AI assistants.
ArcGIS Instant Apps
ArcGIS Instant Apps are lightweight, configurable web applications that allow users to quickly create and share interactive maps and apps without the need for extensive coding or development skills. The templates feature a streamlined experience that lets you build apps quickly and easily using express or full setup modes. All Instant Apps templates can be found on the searchable Instant Apps home page.
ArcGIS Instant Apps templates are regularly updated. On the Instant Apps home page, look for and hover over the announcement badge to learn more about any new, or beta templates, plus updates to existing templates.

Instant Apps updates
Gallery is now out of beta. The Gallery template lets app authors build interactive, filterable galleries of maps, scenes, apps, and layers, helping users quickly find and explore content across their organization. The template now includes the ability to enable a cover page and an introduction window, and a new setting to show or hide an item’s title. This template uses a group to populate the app, and can use either group or organization categories for filtering.

Web Editor is now out of beta and in general availability. With the template, users can configure ArcGIS Web Editor to have focused tools to support various users and workflows, empowering non-GIS focused editors to complete their tasks with a more focused app. Selectable layers can be set by default, and the editing toolbar can be configured to displays only the tools needed for the project at hand, making them easy to find in a layout that’s been customized to provide an efficient editing experience for both GIS and non-GIS users alike. Web Editor now supports new true curve capabilities introduced in ArcGIS Web Editor.
Manager delivers tools that enable users to review and edit data from multiple maps and layers. For example, review problems and feedback with new public transit stations that were collected using crowdsourcing. Use the app configuration to choose each map used in the project that you want included for review. You can now disable autosave in the table.
Attachment Viewer enables users to view photos, videos, and PDF files stored as attachments in a map-focused or attachment-focused layout. Attachment Viewer has been updated with usability enhancements to the filmstrip gallery and the ability to configure the app to open to a feature at start.
Basic enables you to create an app quickly with a minimal interface, allowing you to share your map or scene with any audience. Basic now replaces Media Map and all functionality has been merged, including sketch tools and swipe. Basic now supports video layers in the layer list.
Reporter allows users to submit issues and observations about a specific area using a smart form. Reports are then added onto the map used in the app and can be viewed by other users. They can also view existing reports and use basic map exploration tools to navigate the map. Reporter now includes AI capabilities (beta) to extract information from an image and place it in a form. These beta capabilities are only available to authenticated users and cannot be used in publicly shared apps.
Atlas is designed to provide app users with tools to explore layers in a group with lightweight mapping and data exploration capabilities. It has been updated with an enhanced compass option and the ability to enable the Find current location button. A new option to enable an advanced compass that shows cardinal direction labels. This compass provides more directional clarity to app users when using the app and rotating the map than the standard compass. Both compasses are available to choose from in the configuration
Public Notification enables users to create a list of features using a map that can be exported to CSV or PDF. Search for a single location or draw an area of interest using sketch tools to define a set of features. You can also use the geometry of an existing feature or apply a search buffer to expand the resulting features used to create the list. With this update, Public Notification adds support for custom print services when exporting to PDF.
Nearby guides your app users to places of interest close to an address. This template helps users find focused types of locations (such as schools) within a search distance of an address, their current location, or other place they specify. Nearby introduces a preview of a new layout that delivers a more map-focused experience, with tools arranged along the side. A feedback survey is included to solicit feedback for future work.
For more information, see What’s new in Instant Apps.
ArcGIS Experience Builder
Use ArcGIS Experience Builder to build modern mapcentric or non-mapcentric web apps and webpages without writing code. Start building from scratch, or choose from an extensive library of templates that you can customize. You can add functionality to any template with widgets you can drag, drop, and configure. You can also add custom widgets, themes, and actions with low-code development to further extend your web app.
New Concourse template
Concourse is a new template introduced with this update. It’s a map-centric template featuring a prominent bottom widget controller with large icons and labels. Activated widgets open in a panel in the top right corner for easy access.

New widgets
The Date Filter widget allows you to filter features by choosing a specific date or date range with a calendar tool.
The Theme Mode Switcher widget toggles the app theme between light mode and dark mode.
Other enhancements
Other enhancements include support for copying and pasting features with the Edit widget, support for exporting drawings created with the Draw widget, and support for the Arcade assistant (beta).
For more information and a complete list of all enhancements and additions, see What’s new in Experience Builder.
ArcGIS StoryMaps
Use ArcGIS StoryMaps to combine maps, 3D scenes, embedded content, multimedia, and more into an interactive narrative that can create awareness, influence opinion, and affect change. The easy-to-use builder helps you create digital stories and presentations called briefings that incorporate your GIS work and external content. Stories and briefings can be organized into collections and customized with themes. The following are highlights of recent changes and enhancements.
Side by side infographics
Compare key insights with side-by-side infographics. Open the block palette to select Infographic, then choose from four options: basic, stacked, compact, or titled. Customize the infographic by editing your data and description, or change your layout and customize the colors. For layouts that use an icon, you can choose from over 100 icon options in the settings tab. Add a new row of infographics by clicking the add button to place up to three infographics in a single row to compare data, show relationships, or emphasize key insights.

Theme updates
Provide a fresh, accessible look to your stories with more theming and formatting options. The theme builder now has new shape options, more text sizes, and button alignment. These enhancements provide a more cohesive feel to draw the reader’s eye. Rounded corners give the reader a modern, familiar feel as they read. New text sizes can help to draw attention and make it easier to scan what’s most important. Aligned buttons help maintain consistency and easily guide readers to click and complete the action. These updates improve accessibility by supporting multiple devices and following readability guidelines.
Briefings footer
Briefings now allows authors to add a consistent text footer to their slides. Authors can add their organization’s logo and custom text, such as their organization’s name with a link to their website, to provide a consistent brand presence. This frees up visual space so slide content stays clear and focused.
Frames (beta)
Frames are mobile-first, short-form stories that are easy and fast to make and are optimized for sharing via social platforms. Frames complement (not replace) other StoryMaps formats of stories, briefings, and collections, and seamlessly integrate with your existing ArcGIS workflows. For more information, see Introducing frames.
For more information, see:
What’s new in ArcGIS StoryMaps (November 2025)
What’s new in ArcGIS StoryMaps (December 2025)
What’s new in ArcGIS StoryMaps (January 2026)
ArcGIS Hub
ArcGIS Hub is an enterprise‑class data sharing, collaboration, and engagement platform designed to help people work together to address shared challenges. Through geo‑enabled websites, Hub provides a common space to organize people, unify content, and engage your community of practice.

ArcGIS Hub (basic) is included with every ArcGIS Online subscription and enables organizations to create data-driven sites that support and engage their communities through shared apps, maps, and open data.
ArcGIS Hub Premium builds on these capabilities with advanced tools for stakeholder collaboration and community engagement within and across organizations, including support for events, discussions, and greater configurability. Hub Premium also extends your reach through community member accounts, enabling deeper participation, sustained engagement, and capacity building.
New and enhanced features and capabilities for this update include the following:
Site users can now explore ArcGIS Hub site catalogs using natural language with the ArcGIS Hub assistant (beta), a search agent powered by artificial intelligence (AI).
Site editors can get to work faster in the enhanced workspace overview, with quick and easy access to view, manage, and edit all your Hub content.
Customize your site content with configurable catalogs, giving site editors more control over how you organize and share open data, including by new content collections.
Site visitors can now favorite a site directly from its homepage or pages. Signed-in users can add or remove sites from their favorites using the star icon to find and use those sites again later. This further supports using favorited Hub catalogs directly in ArcGIS Online Map Viewer. For more information, see Using curated data from ArcGIS Hub catalogs.
Web maps embedded on sites now open in Map Viewer instead of Map Viewer Classic.
ArcGIS Hub is updated regularly. For more information, see What’s new in ArcGIS Hub.
ArcGIS Web Editor
ArcGIS Web Editor is a web-based editing app that provides a focused, efficient editing experience in ArcGIS Online. Web Editor combines tools you’re already familiar with, such as snapping, templates, and forms, along with new capabilities.
True curve support
With enhancements to drawing tools in ArcGIS Web Editor, users can now seamlessly combine straight-line and curve segments for greater accuracy when adding and updating features. For example, while digitizing a cul-de-sac, users can start with a straight-line segment, switch to a curve segment, and then go back to a straight-line segment.

Previously, curves were densified or converted into small straight-line segments. Now with true curve support, you can draw and update smooth, clean, true-to-form curves. Drawing tools found on the editing toolbar enable you to add arcs and curves, so you can quickly map features like road centerlines, river corridors, and parcel boundaries. When you edit an existing feature that contains true curves, the curve is preserved rather than broken into smaller straight lines.
Web Editor ArcGIS Instant Apps template
The Web Editor Instant Apps template is now out of beta and in general availability. With the template, users can configure ArcGIS Web Editor to have focused tools to support various users and workflows, empowering non-GIS focused editors to complete their tasks with a more focused app.
For more information, see What’s new in ArcGIS Web Editor.
ArcGIS Notebooks
ArcGIS Notebooks provides a Jupyter notebook experience optimized for ArcGIS, allowing users to combine sophisticated spatial algorithms with powerful open-source Python libraries to develop advanced spatial data science models. ArcGIS Notebooks reduce time spent managing dependencies across data science ecosystems and increase cross-team collaboration and transparency. The following is new with this update:
The ArcGIS Notebooks assistant (beta) is now available. The assistant transforms how users work with Python in ArcGIS by eliminating the need to start from a blank script or rely on generic third-party AI tools. Instead of writing code from scratch, users can generate Python directly from natural-language prompts using ArcPy and the ArcGIS API for Python. This dramatically lowers the barrier for new users to begin automating GIS workflows, while enabling experienced developers to work faster, iterate more efficiently, and focus on higher-value analysis.

ArcGIS Notebooks assistant (beta) offers line-by-line walkthroughs to understand existing code and use prompts to generate Python for administrative, content management, and analysis tasks, leveraging the ArcGIS API for Python or ArcPy. When errors occur, the assistant provides clear guidance and actionable recommendations to resolve issues, along with support for general API for Python and ArcPy questions.
In addition, a new notebook runtime (v13) is now available, which includes new versions of the ArcGIS API for Python, ArcPy, and Python. See the documentation for available Python libraries for more information on notebook runtimes.
See Introducing the ArcGIS Notebooks assistant (beta) for more information.
ArcGIS Data Pipelines
ArcGIS Data Pipelines is a no-code, visual data engineering capability that makes it easy to prepare and integrate data for mapping and analysis workflows. With a drag-and-drop interface, you can connect to a variety of data sources, apply common data preparation tools, and publish the results as a hosted feature layer or table. Data Pipelines can be run on demand or scheduled to run automatically, reducing manual effort and ensuring your organization’s data stays current and ready for use.
Updates include the following new capabilities and enhancements:
Connect to secure URLs and Databricks
Users can now connect to secure URLs and Databricks tables directly through ArcGIS Data Pipelines, expanding the range of places from which customers can bring in data. Previously available in beta, these inputs are now generally available, equipping users with the capacity to accommodate more workflows in ArcGIS Online.
Email notifications for failed runs (beta)
Users can opt in to receive email notifications when scheduled data pipeline task runs fail. This keeps them informed and enables quick action to ensure that their organization’s maps and apps stay up to date with the latest information. This feature is in beta.
For more information, see What’s new in ArcGIS Data Pipelines.
ArcGIS Velocity
ArcGIS Velocity enables the ingestion of live, constantly changing location data from streaming sources, sensors, vehicles, equipment, weather services, and many other common real-time providers. It also helps users process, visualize, and analyze real-time data feeds to trigger alerts automatically, and publish data for maps, dashboards, and historic analysis. Recent updates include the following:
New feeds and output enhancements
The new ADS-B Exchange feed enables Velocity users to easily ingest real-time aircraft tracking data from the ADS-B Exchange API, which leverages a global network of aviation enthusiasts and sensors. This integration supports enhanced situational awareness for airspace monitoring, flight tracking, and airport operations. Users can visualize aircraft positions, analyze air traffic patterns, and seamlessly integrate aviation data into workflows for transportation, emergency response, and logistics planning.
Users can now ingest automatic identification system (AIS) data from Kpler into Velocity with the Kpler Feed. Kpler provides real-time visibility into global maritime vessel movements, helping organizations make more informed decisions across logistics, supply chain management, and maritime operations. By ingesting the Kpler AIS feed, users can track vessel locations, analyze traffic patterns, and improve situational awareness.
More flexibility has been added to the Trimble Unity Maintain output for real-time work order automation. Two new optional parameters, Entity Type and Entity UID, have been added to the Create Work Order operation in Trimble Unity Maintain output. This helps minimize the need to create and manage multiple templates for different entities and helps streamline your integrations.
For more information, see What’s new in ArcGIS Velocity.
ArcGIS Workflow Manager for ArcGIS Online
ArcGIS Workflow Manager for ArcGIS Online is a complete software as a service (SaaS) workflow management system for automating and streamlining your business processes. Save on infrastructure costs and maintenance by using a secure, scalable, and performant cloud environment to orchestrate your online workflows.

The February 2026 release brings several enhancements aimed at improving productivity and user experience. Key highlights include the ability to delete underlying extended property tables when a job template is deleted, and the option for managers to open identified jobs directly from the Manage page list, reducing the number of clicks required. Administrators will benefit from the new search functionality for workflow steps, making it easier to update diagrams.
Additionally, the release introduces a new closed_by field for querying closed jobs and improved responsiveness of job cards on the Work page. Other notable updates include improved map symbolization, the ability to show child jobs, and the option to add notes to a job while a step is running.
For more information, see What’s new in Workflow Manager.
ArcGIS Solutions
ArcGIS Solutions provides a collection of industry-specific configurations of ArcGIS that align with your organization’s needs, transform your use of ArcGIS, and help you maximize your investment in location-based data and technology. These mapping solutions leverage your authoritative data and are designed to improve operations; provide new insight; and enhance services in government, utility, defense, public safety, and telecommunications organizations.

The February release of ArcGIS Solutions includes enhancements making the discovery, deployment, and configuration of ArcGIS Solutions faster and easier.
ArcGIS Solutions assistant (beta)
The ArcGIS Solutions assistant (beta) is your new AI-powered personal assistant that helps you discover solutions that align with your business needs. You can ask natural language questions, discover implementation guidance, and even interact with the ArcGIS Solutions app in many languages.
Solutions app improvements
The latest update to the ArcGIS Solutions app also includes a new user experience that provides rich information for every solution. Enhanced management capabilities help you rename solution items or delete a solution if you no longer need it. Consolidated access to these new management capabilities, solution diagrams, documentation, and other resources accelerate your configuration and use of a given solution.
For more information, see the ArcGIS Solutions resources or the ArcGIS Solutions release blog article.
ArcGIS Living Atlas
Find ready-to-use, trusted content from the GIS community in the form of layers, maps, apps, tools, and 3D scenes. Easily access this collection of content to quickly kickstart your ArcGIS Online workflows, saving you time and effort.
Living Atlas content is published and updated regularly. For the latest news and information, see the ArcGIS Living Atlas home and the ArcGIS Living Atlas blog. The following are highlights of new spatial content available within Living Atlas.
Imagery layers optimized for analysis
Select Living Atlas imagery layers have been optimized for analysis. The full collection of optimized layers can be found in the Living Atlas Imagery Layers Optimized for Analysis group. You can also use search at the Living Atlas browse tab to return the same list of optimized layers. For more information, see ArcGIS Living Atlas ready-to-use imagery layers for analysis.
Overture Maps basemaps and layers
Esri now provides a new collection of 2D and 3D basemaps and layers built from Overture Maps, a global open data project co-founded by Amazon, Meta, Microsoft, TomTom, and Esri. Overture Maps aims to create the world’s most comprehensive open geographic database.

U.S. American Community Survey (ACS)
These ready-to-use ACS layers enable GIS analysts to begin to explore, map, and analyze many demographic, social, economic, and housing topics. The multi-scale layers have data for state, county, and tract levels. Free access to these layers in ArcGIS Living Atlas significantly reduces the time GIS users spend downloading, processing, and joining data. The latest 5-year estimates are now available for state, county, and tract geography levels in Living Atlas, including new housing and race attributes. If you have used the Census ACS layers in the past, you’ll want to consider transitioning to these updated versions which will be updated annually. See U.S. Census ACS update available in ArcGIS Living Atlas.
")
Global Fishing Watch
The new Global Fishing Watch layers bring together a suite of core datasets designed to illuminate different aspects of human activity at sea including vessel presence, fishing effort, SAR detection, and SAR infrastructure. For more information, see Introducing Global Fishing Watch layers.

Global Water Risk
This global dataset provides a comprehensive water risk framework from the World Resources Institute (WRI). It includes indicators such as water stress, water depletion, untreated connected wastewater, and unimproved/no drinking water. You can visualize water scarcity by different projected scenarios to better understand 13 distinct water risk indicators covering physical and regulatory factors. For more information, see Global Water Risk from Aqueduct in Living Atlas.

Global Bioclimate Projections
The CHELSA bioclimate projections in the Living Atlas have been incredibly popular with the GIS community, and now we have enhanced the collection to include Growing Degree Days above 10 °C, Net Primary Productivity, Snow Cover Days, and Snow Water Equivalent. The new layers provide crucial insights into the future impact of climate change on ecosystems and human wellbeing. For more information, see Expanding the CHELSA bioclimate projection collection.

Google Photorealistic 3D basemaps (beta)
The Google Photorealistic 3D basemaps (beta) provides a three-dimensional mesh textured with high-resolution imagery, addressing the growing demand for moving from 2D to fully photorealistic 3D maps. The basemaps serve as an entry point for users entering into the 3D space who need quick access to a high-resolution 3D basemap foundation for visualization, storytelling, and analysis workflows. Two Google 3D basemaps are now available: Photorealistic and Photorealistic Hybrid.

In addition to being available in ArcGIS Pro, users are now able to select the Google Photorealistic 3D basemaps (beta) from the basemap gallery in ArcGIS Scene Viewer, Instant Apps, and Experience Builder, allowing users to create web scenes and web apps to share with their audience.
For more information, see Experience the Google Photorealistic 3D basemap in ArcGIS Online.
More information
For more information and additional details about this update, see the What’s new help topic or view all posts related to this release. You can also watch an introductory video to see new capabilities in action.
Visit the ArcGIS Online Esri Community to ask questions, view blogs, learn from peers, and submit your ideas for future enhancements.

Article Discussion: