The ArcGIS API for JavaScript (ArcGIS JS API) version 4.16 added support for labeling point clusters. This has been one of the most popular enhancement requests since clustering was released.
Clustering is a method of merging nearby and overlapping features into a single symbol to reduce cluttered features in the view. The size of the cluster icon indicates the number of features in each cluster relative to other clusters. Adding a label can provide more precise context to the features represented by the cluster.
For example, check out this example of earthquakes that occurred along the Aleutian Islands in Alaska over the last 30 days.

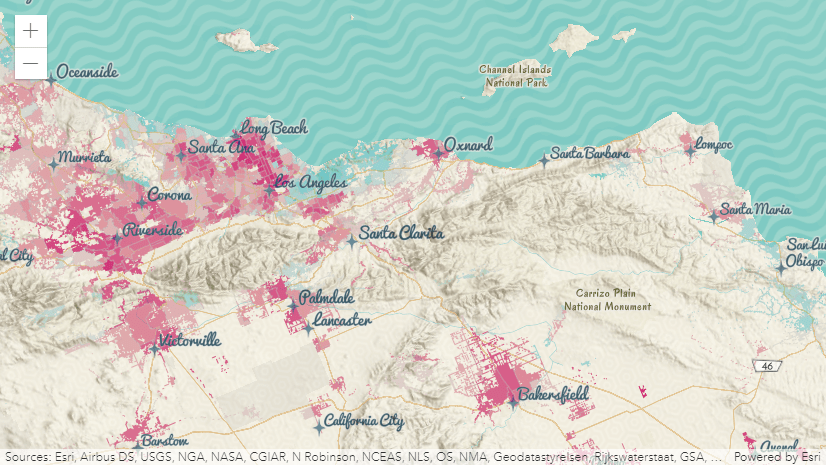
Clustering helps you immediately see where more points are densely located than others. When clustering is not enabled, it’s difficult to discern areas with a lot of overlapping points.
Notice how the cluster of 1,000+ earthquakes in the previous image is not discernible when the same layer is not clustered.

In fact the area where those 1,000+ earthquakes occurred is so small, most users will incorrectly assume there are fewer earthquakes in that location.
Show cluster counts
Labeling clusters is very similar to labeling individual features in a layer. Just like the FeatureLayer.labelingInfo property of the FeatureLayer, FeatureReductionCluster now has a labelingInfo property that allows you to configure cluster labels.
That means you have full control over the label’s font, symbol, placement, and text. The following code will display cluster counts in the center of the cluster.
const clusterConfig = {
  type: "cluster",
  clusterRadius: "100px",
  // increase the min cluster size
  // to fit cluster labels
  clusterMinSize: "24px",
  clusterMaxSize: "60px",
  // {cluster_count} is an aggregate field containing
  // the number of features comprised by the cluster
  labelingInfo: [
    {
      // allows for slight label overlap
      deconflictionStrategy: "none",
      labelExpressionInfo: {
        // Arcade expression formatting the cluster count
        expression: "Text($feature.cluster_count, '#,###')"
      },
      symbol: {
        type: "text",
        color: "#004a5d",
        font: {
          weight: "bold",
          family: "Noto Sans",
          size: "12px"
        }
      },
      labelPlacement: "center-center"
    }
  ]
};

layer.featureReduction = clusterConfig;
Here are a few properties introduced at version 4.16 of the ArcGIS JS API worth mentioning.
clusterMinSize/clusterMaxSize. Now you can configure the size of your smallest and largest clusters. All other cluster sizes interpolate linearly. The default size (12px) of the smallest cluster is a bit too small to house a readable label. Therefore, you may find yourself bumping this value up to something like 18-24px to get something that looks better with the label. Any time you change the clusterMaxSize you should also consider adjusting the clusterRadius.
deconflictionStrategy – Labeling in the ArcGIS JS API has always supported label deconfliction. Otherwise, most labels would be illegible. However, when it comes to displaying labels for clusters, it’s generally preferable to turn off label deconfliction so all cluster counts display. Now you have the option to disable label deconfliction. This looks better than removing labels when there’s only a little overlap.

Advanced Labels
Given there is no limitation to the labelingInfo spec for clusters compared to layer labeling, you have the flexibility to style labels however you want and present summary information related to the renderer beyond the cluster count. You can add as many label classes as you want to create a rich experience for the end user.
Check out the following sample, which adds six label classes to the FeatureReductionCluster labelingInfo. Note the various scale constraints, label placements, and symbol configurations for each.
Expand to view the code for all six label classes
const clusterConfig = {
  type: "cluster",
  // larger radii look better with multiple label classes
  // smaller radii looks better visually
  clusterRadius: "120px",
  labelsVisible: true,
  labelingInfo: [
    {
      symbol: {
        type: "text",
        haloColor,
        haloSize: "1px",
        color,
        font: {
          family: "Noto Sans",
          size: "11px"
        },
        xoffset: 0,
        yoffset: "-15px"
      },
      labelPlacement: "center-center",
      labelExpressionInfo: {
        expression: "Text($feature.cluster_count, '#,### plants')"
      },
      where: `cluster_avg_capacity_mw > ${clusterLabelThreshold}`
    },
    {
      symbol: {
        type: "text",
        haloColor,
        haloSize: "2px",
        color,
        font: {
          weight: "bold",
          family: "Noto Sans",
          size: "18px"
        },
        xoffset: 0,
        yoffset: 0
      },
      labelPlacement: "center-center",
      labelExpressionInfo: {
        expression: "$feature.cluster_type_fuel1"
      },
      where: `cluster_avg_capacity_mw > ${clusterLabelThreshold}`
    },
    {
      symbol: {
        type: "text",
        haloColor,
        haloSize: "1px",
        color,
        font: {
          weight: "bold",
          family: "Noto Sans",
          size: "12px"
        },
        xoffset: 0,
        yoffset: "15px"
      },
      deconflictionStrategy: "none",
      labelPlacement: "center-center",
      labelExpressionInfo: {
        expression: `
          var value = $feature.cluster_avg_capacity_mw;
          var num = Count(Text(Round(value)));

          Decode(num,
            4, Text(value / Pow(10, 3), "##.0k"),
            5, Text(value / Pow(10, 3), "##k"),
            6, Text(value / Pow(10, 3), "##k"),
            7, Text(value / Pow(10, 6), "##.0m"),
            Text(value, "#,###")
          );
        `
      },
      where: `cluster_avg_capacity_mw > ${clusterLabelThreshold}`
    },
    {
      symbol: {
        type: "text",
        haloColor,
        haloSize: "1px",
        color,
        font: {
          family: "Noto Sans",
          size: "11px"
        },
        xoffset: 0,
        yoffset: "-15px"
      },
      labelPlacement: "above-right",
      labelExpressionInfo: {
        expression: "Text($feature.cluster_count, '#,### plants')"
      },
      where: `cluster_avg_capacity_mw <= ${clusterLabelThreshold}`
    },
    {
      symbol: {
        type: "text",
        haloColor,
        haloSize: "2px",
        color,
        font: {
          weight: "bold",
          family: "Noto Sans",
          size: "18px"
        }
      },
      labelPlacement: "above-right",
      labelExpressionInfo: {
        expression: "$feature.cluster_type_fuel1"
      },
      where: `cluster_avg_capacity_mw <= ${clusterLabelThreshold}`
    },
    {
      symbol: {
        type: "text",
        haloColor,
        haloSize: "1px",
        color,
        font: {
          weight: "bold",
          family: "Noto Sans",
          size: "12px"
        },
        xoffset: 0,
        yoffset: 0
      },
      labelPlacement: "center-center",
      labelExpressionInfo: {
        expression: `
          var value = $feature.cluster_avg_capacity_mw;
          var num = Count(Text(Round(value)));

          Decode(num,
            4, Text(value / Pow(10, 3), "##.0k"),
            5, Text(value / Pow(10, 3), "##k"),
            6, Text(value / Pow(10, 3), "##k"),
            7, Text(value / Pow(10, 6), "##.0m"),
            Text(value, "#,###")
          );
        `
      },
      where: `cluster_avg_capacity_mw <= ${clusterLabelThreshold}`
    }
  ]
};

While the labels help make this visualization easy to explore, it takes a lot of time to get the labels right. In fact, placing this much information in labels may not be necessary in most scenarios because of the issue I describe below.
Also, when you label clusters with summary information, you should also consider adding complementary labels on individual features that don’t belong to a cluster. The sample above demonstrates this as well.
Suggested default labels
Since cluster count may not be the only label of importance to the user, we added the getLabelSchemes method in the new esri/smartMapping/labels/clusters module to generate suggested primary and secondary label classes for use in clustering.
All label classes are based on the fields used by the layer’s renderer. This can especially come in handy with complex renderers that refer to multiple fields and Arcade expressions.
Simply reference the layer and view in the method. Then you can apply any of the primary or secondary label schemes on the layer’s featureReduction property.
// Sets a suggested popupTemplate on the layer based on its renderer
clusterLabelCreator.getLabelSchemes({
  layer: featureLayer,
  view: view
}).then(function(labelSchemes){
  // labelSchemes has a `primaryScheme` and `secondarySchemes`
  const featureReduction = featureLayer.featureReduction.clone();
  const { labelingInfo, clusterMinSize } = labelSchemes.primaryScheme;
  featureReduction.labelingInfo = labelingInfo;
  featureReduction.clusterMinSize = clusterMinSize;

  featureLayer.featureReduction = featureReduction;
}).catch(function(error){
  console.error(error);
});
The suggested label classes generated for number fields will contain a TextSymbol with a color and halo that look good for most renderer configurations. Label expressions will look something like the following to improve the formatting of larger clusters.
// clusterField can be either
// {cluster_count} or
// {cluster_avg_FIELDNAME}
// where FEILDNAME is the name of
// a number field used by the renderer
$feature["${clusterField}"];
var value = $feature["${clusterField}"];
var num = Count(Text(Round(value)));
var label = When(
  num < 4, Text(value, "#.#"),
  num == 4, Text(value / Pow(10, 3), "#.0k"),
  num <= 6, Text(value / Pow(10, 3), "#k"),
  num == 7, Text(value / Pow(10, 6), "#.0m"),
  num > 7, Text(value / Pow(10, 6), "#m"),
  Text(value, "#,###")
);
return label;
Check out the Point clustering – generate suggested configuration sample to see how this works in a live app.

Experiment with alternate label schemes and configurations
While the primary labeling scheme usually involves placing the cluster count in the center of the cluster, you may be given a primary scheme that involves another attribute. For example, when generating label classes for any layer rendered with a size visual variable, the default scheme will suggest labeling clusters with the average value of the field or expression used in the size variable. This should provide clarity to the end user since the size variable referenced in the renderer is reused as the cluster size variable.
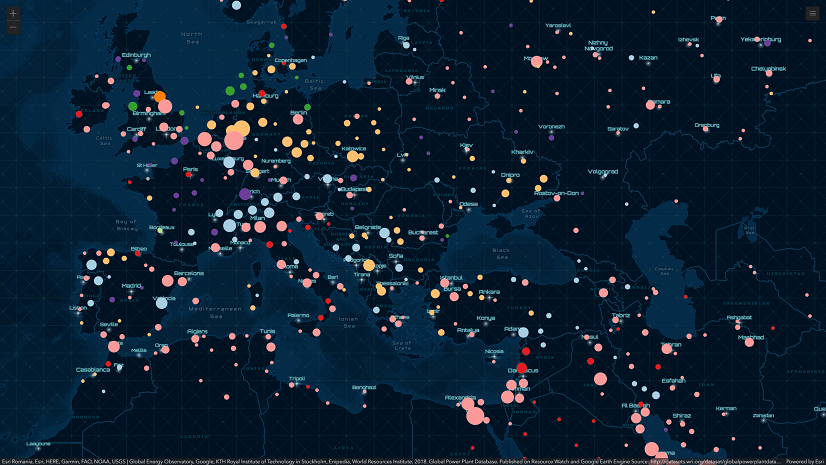
For example, given a UniqueValueRenderer containing a size variable in the power plants layer, the primary scheme will show the average capacity of power plants.

If the layer’s renderer did not include a size variable, then cluster size would indicate the count. Therefore, the suggested primary labelingInfo would display the count.

Given the renderer is a UniqueValueRenderer, you could use the predominant fuel type provided in the secondary label schemes to label each cluster.

Or you can use all available schemes to show summary information about each cluster. This requires some rearranging using the LabelClass label placement and TextSymbol offset properties.

A final thought
In previous posts about clustering, I stated the following, and it is worth repeating:
Clustering options available via featureReduction do not perform complex statistical analyses. Therefore, the clustering visualizations described above should not be interpreted as precise, statistically significant “clusters” of data. Rather, they should merely be approached as a nice summary of the data, providing you with a preview to potentially identify spatial patterns that may or may not reveal significant storylines.
Also, be sure to check out the newly documented configuration best practices in the FeatureReductionCluster class description and the updated clustering samples:

Noice