Kristian Ekenes
Connect:

Kristian is a Principal Product Engineer at Esri specializing in data visualization. He works on the ArcGIS Maps SDK for JavaScript, ArcGIS Arcade, and Map Viewer in ArcGIS Online. His goal is to help developers be successful, efficient, and confident in building web applications with the JavaScript Maps SDK, especially when it comes to visualizing data. Prior to joining Esri, he worked as a GIS Specialist for an environmental consulting company. He enjoys cartography, GIS analysis, and building GIS applications for genealogy.

Posts by this author
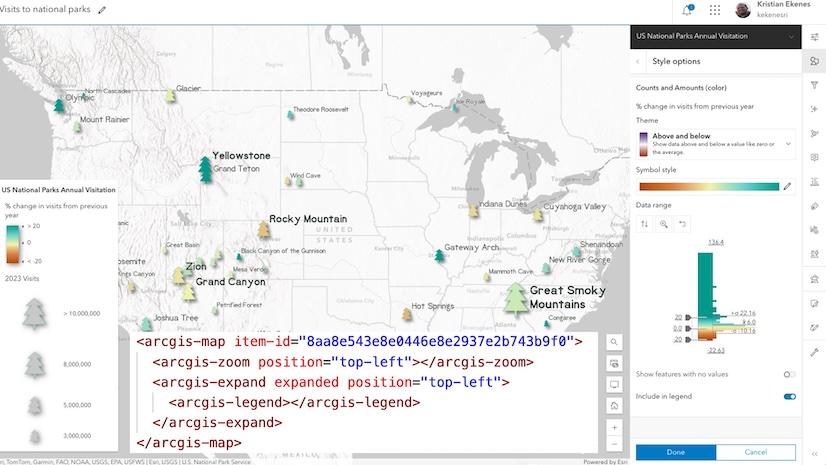
Five under-appreciated Arcade functions

These Arcade functions don't get enough love.

Continue Reading

Visualize data from related records using Arcade

Learn why rendering data from related records is challenging and what you can do about it.

Continue Reading

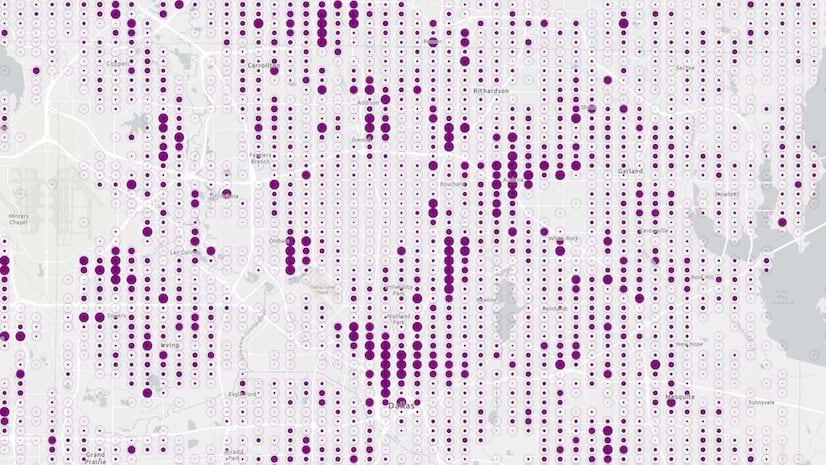
Five ways to visualize point density using the same dataset

Explore five different ways to visualize point density on the web using the same dataset.

Continue Reading

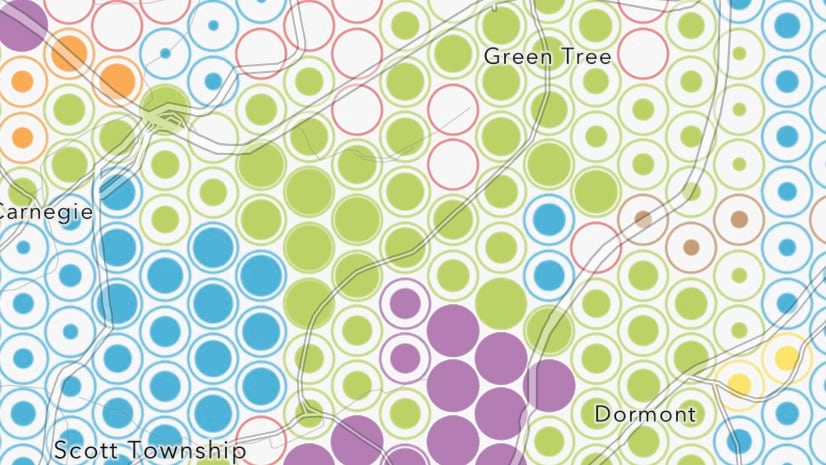
Density mapping with binning and Wurman dots

Thanks to binning, creating a Wurman dot density visualization is more accessible than ever before.

Continue Reading

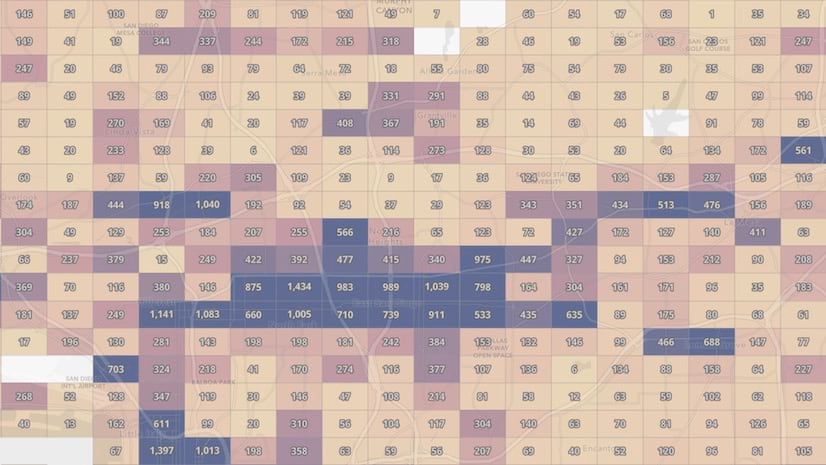
How to summarize aggregate data using Arcade in popups

Arcade can help you create dynamic, interactive popup content summarizing aggregate data in binning visualizations.

Continue Reading

8 ways to style point clusters on the web

Learn the various ways you can customize the style of point clusters in web apps.

Continue Reading

Introducing new Arcade documentation

Learn about the new Arcade documentation pages and why making these changes was necessary for improving the experience of learning Arcade.

Continue Reading

How to create a custom Arcade profile

Learn how to create a custom Arcade profile and execute expressions in the context of a web app.

Continue Reading

Execute Arcade expressions on your terms

Have you ever wanted to run an Arcade script outside of a traditional Arcade profile? Now you can.

Continue Reading

1 2 3 9