Every drop truly matters. Across the United States, water utilities are feeling the pressure like never before. With population growth, urban expansion, agriculture, drought, and industrial development all competing for limited resources, our water supply is under immense strain. Experts predict that by 2030, demand for fresh water could outpace supply by as much as 40 percent.
But the challenge isn’t just about meeting rising demand; it’s also about what we’re losing along the way. Today, nearly 20 percent of treated water never makes it to a paying customer. That’s approximately 2.7 trillion gallons and $6.4 billion lost every year. Now more than ever, utilities need clarity on where and why water loss is happening. Understanding and addressing these losses is critical to building a resilient, sustainable future for our communities.
Understanding and Tackling Non-Revenue Water
Pinpointing water loss isn’t as straightforward as spotting a burst main in the street. Many leaks are hidden, sometimes for years, quietly draining precious resources and revenue. And while leakage is a major contributor to non-revenue water, it’s not the whole story. Data errors, meter inaccuracies, and authorized unbilled consumption all play a part.
Managing water loss means looking beyond the obvious fixes. It requires a deeper understanding of what’s happening inside our distribution systems. That’s why utilities are investing in advanced metering, smart leak detection, real-time system integration, and powerful spatial analysis. Geographic information system (GIS) technology is central to this transformation, bringing together critical data, revealing patterns, and empowering teams to develop proactive, effective water loss strategies.
Across the country, utilities are embracing innovative, integrated solutions like ArcGIS to gain the visibility and control they need. The following case studies showcase how modern digital solutions are making a measurable difference by helping utilities identify, track, and reduce water loss.
Case Studies in Water Loss Reduction
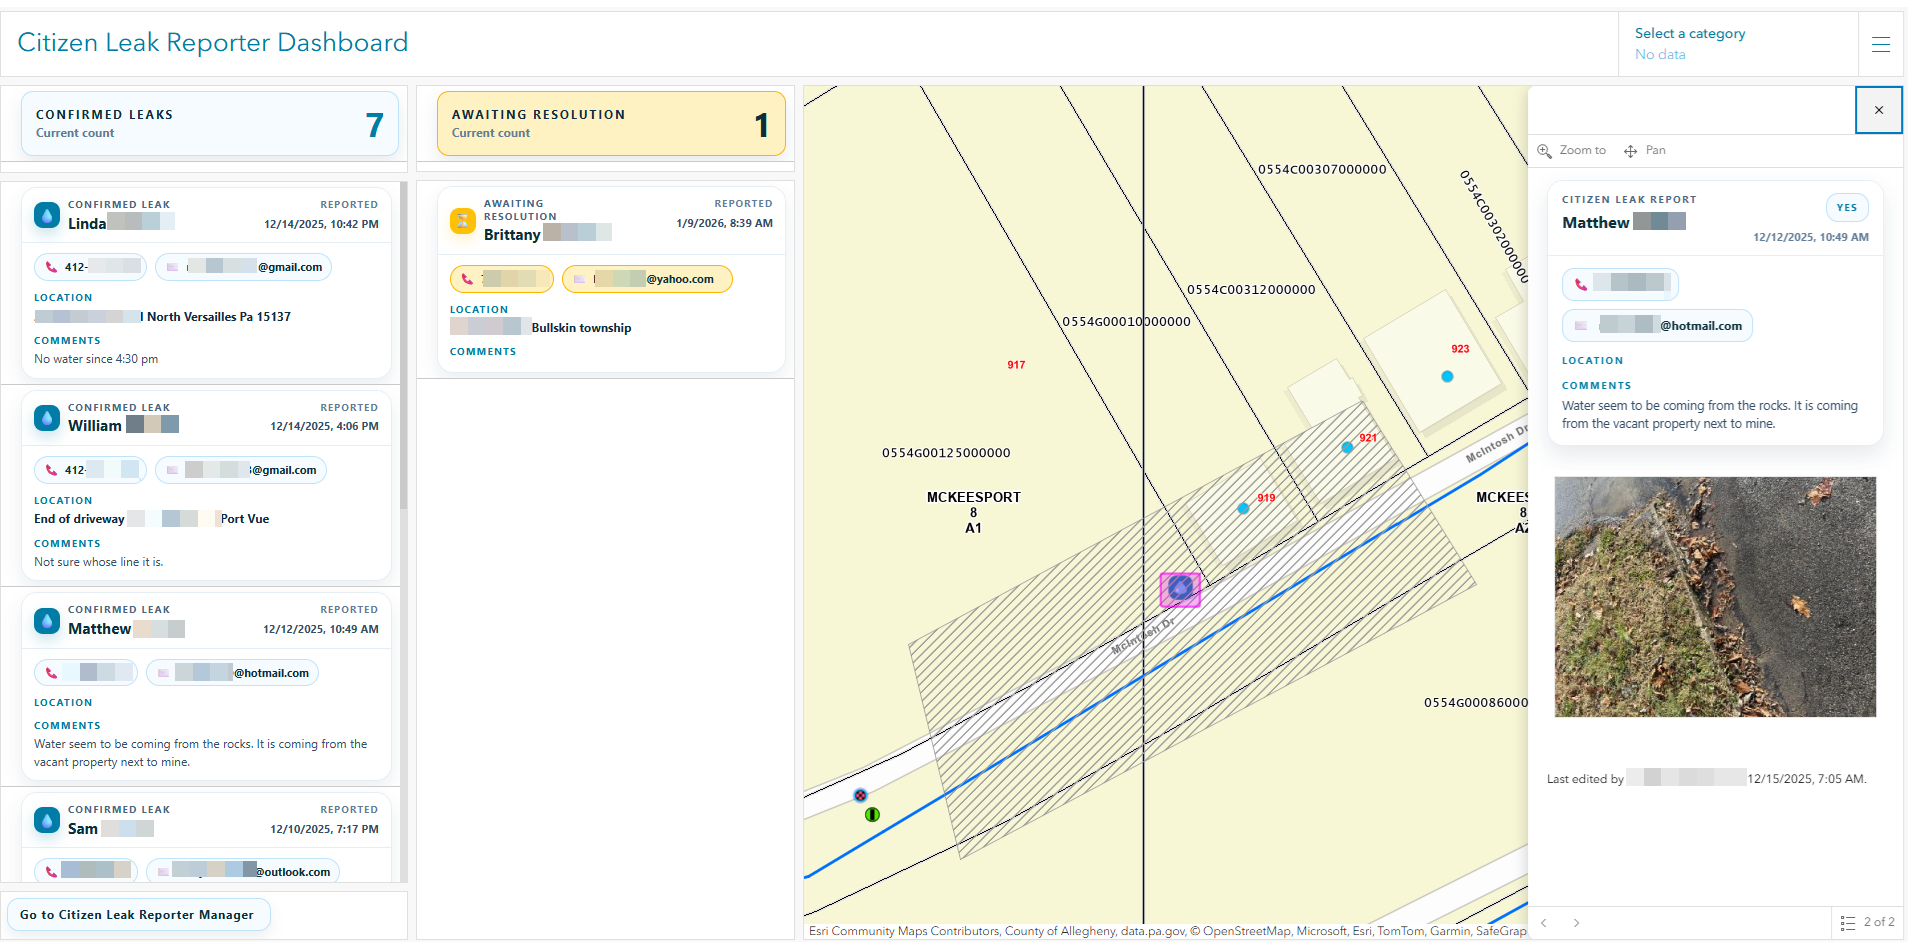
The Municipal Authority of Westmoreland County (MAWC) in Pennsylvania faced a critical challenge during a drought, when minimizing non-revenue water became essential to preserve reservoir supplies. To address this, MAWC implemented a GIS-powered, multipronged leak detection strategy using Esri tools such as ArcGIS Survey123, ArcGIS Dashboards, and ArcGIS Field Maps. A public-facing app enabled residents to report leaks by pinpointing locations and uploading photos, while field staff used mobile mapping to efficiently investigate and repair leaks.
This approach proved highly effective, with nearly 70 percent of citizen-reported leaks confirmed as true main line issues and 66 percent of all public reports leading to repairs. The GIS-enabled system allowed MAWC to quickly respond to leaks, prioritize repairs, and maintain water supply during drought conditions. The success of these tools led MAWC to continue using the public reporting app beyond the drought, significantly improving operational efficiency and water loss prevention.
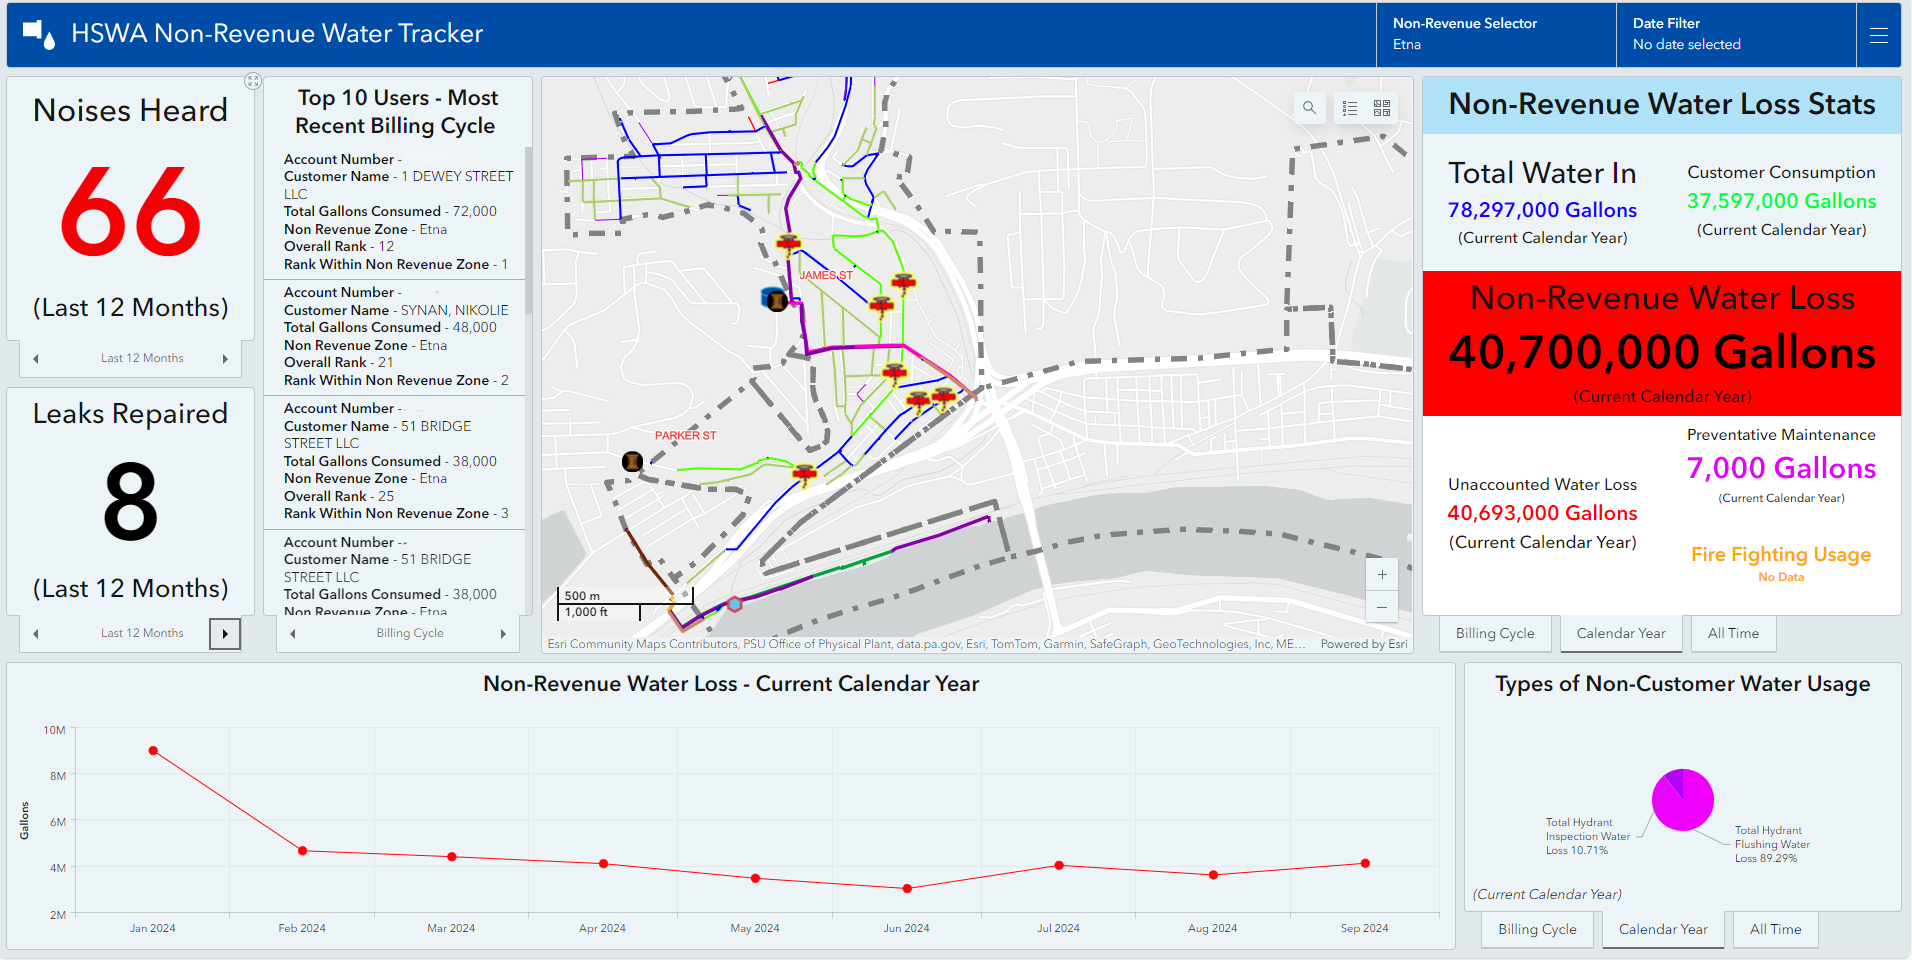
Hampton Shaler Water Authority (HSWA) faced significant non-revenue water challenges, with over 35 percent of distributed water unaccounted for due to leaks, billing errors, and operational uses. To address this, HSWA invested in GIS technology to integrate regional master meter data, customer meter reads, and flushing records into a centralized GIS database. This system, supported by ArcGIS Dashboards and automated data imports, enabled the utility to track water usage, identify leaks, and monitor non-revenue water trends across five regional areas.
The results have been substantial: In the Etna area alone, tracking and repairing leaks reduced water loss by six million gallons per month, while a major underground leak in Sharpsburg was detected and fixed thanks to the new data-driven approach. The GIS-enabled process has improved operational decision-making, supported both short- and long-term maintenance planning, and saved millions of gallons of water. Encouraged by these successes, HSWA plans to expand the program to additional regions and further enhance its water loss management capabilities.
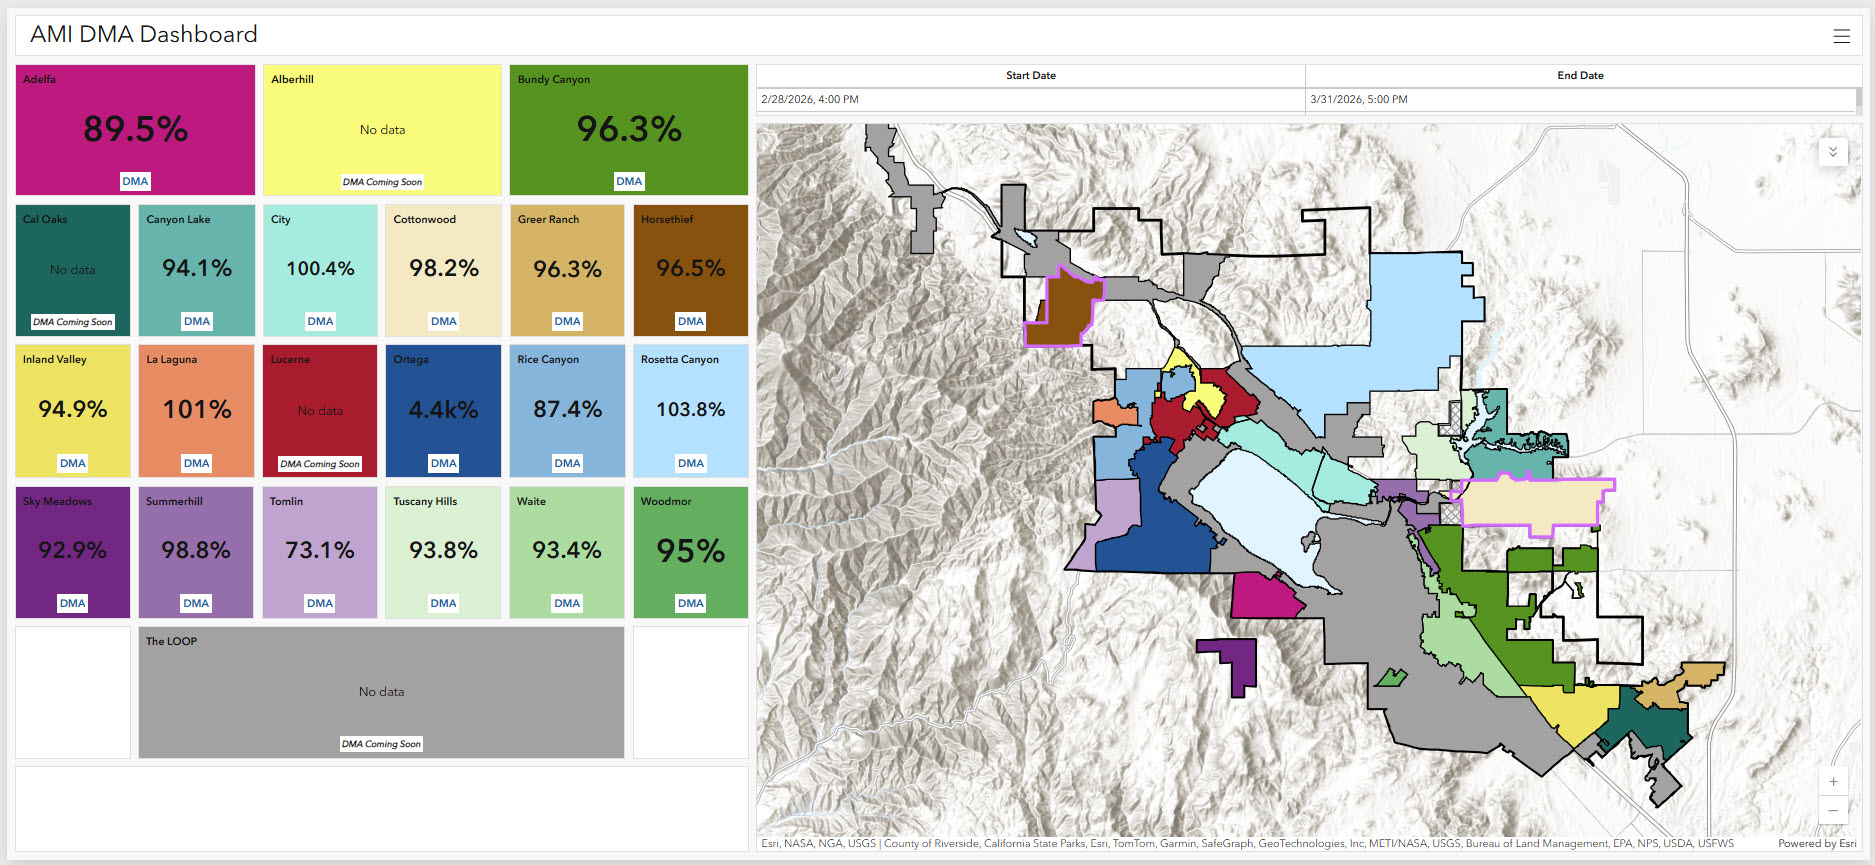
Elsinore Valley Municipal Water District (EVMWD) undertook a major initiative to reduce water loss by integrating advanced metering infrastructure (AMI) with their GIS. Over two years, the utility installed 45,000 meter radios and Data Collection Units, enabling the collection of over a million data points daily. This data was combined with customer, operational, and SCADA information to create a comprehensive, spatially enabled model of their water distribution system. By dividing the service area into District Metered Areas (DMAs) and visualizing water efficiency and loss within each zone, EVMWD could quickly pinpoint problem areas, prioritize leak investigations, and make informed decisions about maintenance and repairs.
The integration of AMI and GIS empowered EVMWD to move from reactive to proactive water loss management. Custom dashboards provide clear, actionable insights for both operations and administration, streamlining the identification of leaks, faulty meters, and inefficiencies. The project’s success has led to ongoing expansion, with most DMAs now actively monitored and further integration with SCADA and recycled water systems planned. This approach has not only improved operational efficiency but also set the stage for continued innovation in water resource management.
The Power of GIS in Water Loss Management
Geographic information systems are changing the game for water utilities tackling non-revenue water. By delivering the spatial insight and analytical power needed to pinpoint, monitor, and address water loss, GIS gives utilities a clear view of what’s happening across their networks. When you connect GIS with advanced metering, customer data, and operations, you can break your system into targeted zones, visualize water movement, and quickly spot leaks or inefficiencies—often before they become major issues.
GIS-powered dashboards and apps put actionable information at everyone’s fingertips, empowering both staff and the community to report leaks, track repairs, and see the results in real time. This kind of data-driven approach means utilities can move from reactive fixes to proactive strategies. They can streamline leak detection, prioritize maintenance, and make more informed decisions about where to invest. The result? Less water lost, greater operational efficiency, and meaningful progress towards sustainability.
Today’s utilities are embracing modern GIS to bring together infrastructure, sensor data, and workflows like never before. By integrating GIS with AMI, SCADA, and asset management systems, they’re gaining real-time visibility and prioritizing repairs. They’re also measuring progress, ensuring that every drop counts.
Here’s how GIS is making a difference:
- Leak Detection, Analysis, and Response: ArcGIS enables utilities to map their networks, overlay sensor and meter data, and integrate real-time information from AMI, SCADA, and IoT sensors. This allows for rapid identification of leaks, high-risk areas, and abnormal usage patterns, supporting faster and more targeted repairs.
- Field Operations and Public Engagement: ArcGIS mobile apps empower field crews to locate assets, document leaks, and update records instantly, while public-facing apps allow customers to report leaks or water issues. This combination accelerates leak detection and ensures data is current and accessible.
- Asset Management and Predictive Maintenance: By linking asset data (such as age, material, and maintenance history) and analyzing historical and topographical information, ArcGIS supports predictive maintenance, smarter capital planning, and prioritization of replacements and repairs to reduce future water loss.
- Monitoring, Reporting, and Water Audits: ArcGIS enables utilities to segment service areas for water audits, monitor water balance, and use dashboards to visualize billing, consumption, and operational data. This supports efficient monitoring, transparent reporting, and continuous improvement in water loss management.
Building Sustainable Water Utilities
There’s no easy button to stop water loss, but with ArcGIS, utilities finally have the clarity and context they need to make every drop count. By breaking down data silos, enabling real-time insights, and empowering proactive maintenance, GIS is helping utilities shift from reactive repairs to truly strategic, sustainable water management.
Looking ahead, the integration of GIS with digital twins, advanced analytics, and collaborative platforms will accelerate our journey toward sustainability. With GIS as a guide, utilities are better equipped than ever to see the unseen, protect resources, and deliver value to their communities.

Article Discussion: