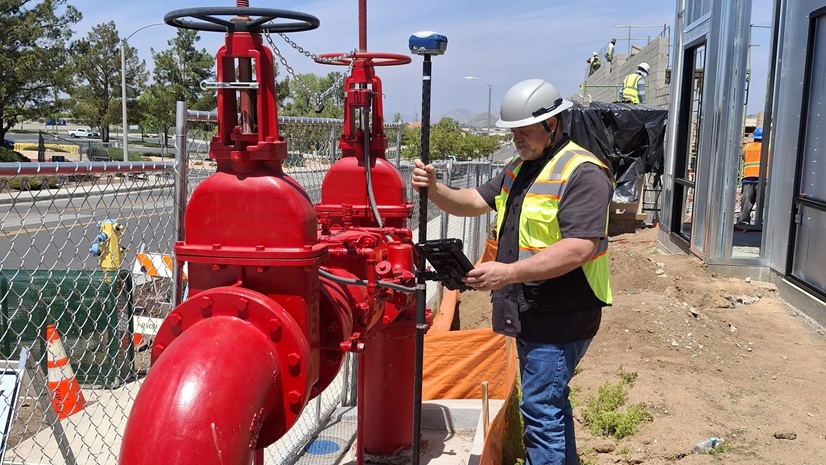
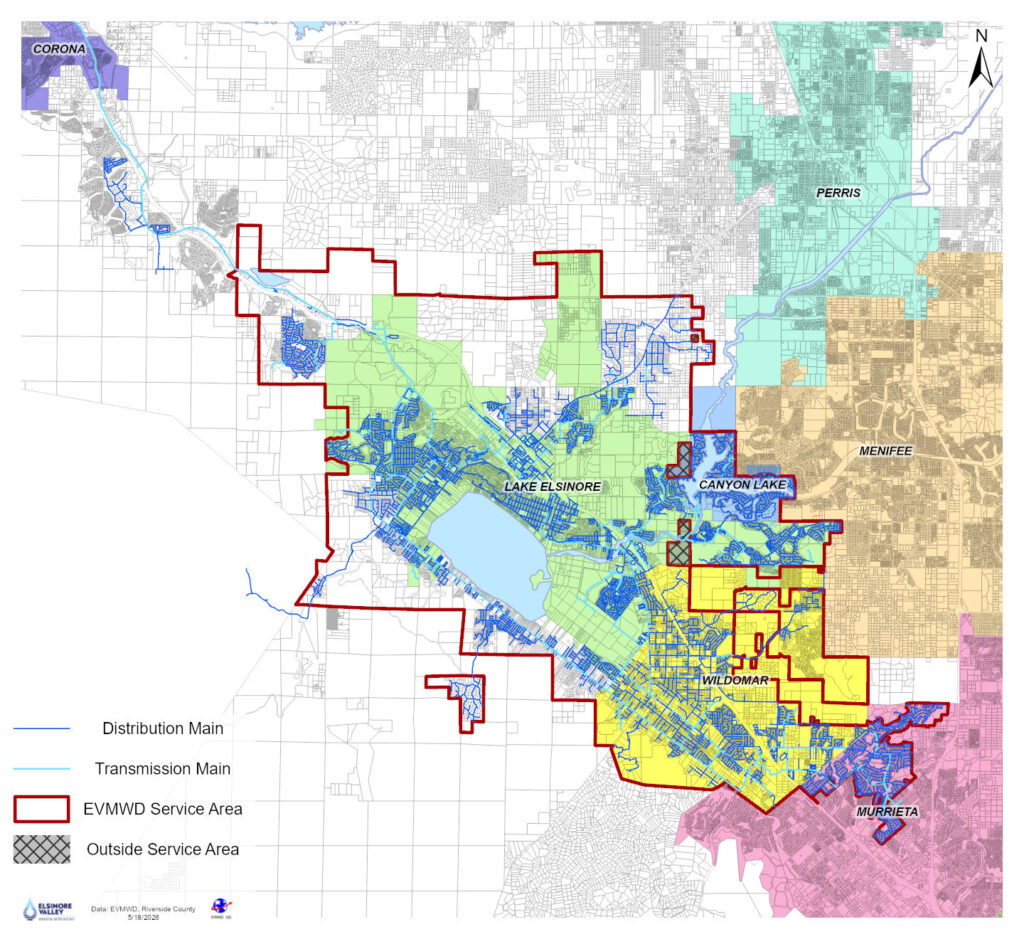
Elsinore Valley Municipal Water District (EVMWD) is a public utility agency that provides water, wastewater, irrigation, recycled water, and non-potable water services to customers in the southwestern portion of Riverside County of California. Most of EVMWD’s customers receive potable water services, with close to 50,000 water system connections serving approximately 169,000 customers across 70 different pressure zones and 55 water audit zones. This system is supported by 4 water treatment facilities, 67 water reservoirs, 53 pump stations, and 766 miles of pipeline stretching from Corona through Temescal Valley, Lake Elsinore, Canyon Lake, Wildomar, and reaching down into parts of Murrieta.
The efficiency EVMWD has been able to get from their water system relies heavily on the management and organization behind the distribution of water throughout the system. EVMWD’s water operations team works tirelessly on efforts of improvements, inspections, and research into ensuring that the water system is properly providing to the customers while also finding ways to ensure the water distribution network can handle future developments, necessary replacements, or emergency responses within the service area.
Implementing AMI Across Elsinore Valley
Several years ago, EVMWD’s water operations department and the IT department held meetings to discuss the possibility of integrating advanced metering infrastructure (AMI) into the district’s current potable water distribution system. The project was originally seen as difficult, but the long-term benefits justified the effort. This AMI integration project was expected to generate data that revealed system details that were previously unknown or required an extensive amount of physical work to obtain. These uses included validating customer data in the customer information system (CIS), documenting conservation efforts across the service area, providing insight into meter status and accuracy, and enabling research and analysis focused on potential water loss.
EVMWD worked alongside a third-party vendor to install approximately 45,000 meter radios across the service area. With complicated topography and 27 square miles to cover, 69 data collection units (DCUs) were also installed across the service area for the purpose of capturing the data transmitted by the AMI radios. The integration of AMI into EVMWD’s water distribution system took approximately two years to fully implement. After the DCUs and AMI radios had all been installed, EVMWD had a chance to see the data. The raw data was extensive and the amount of data that was being received had reached a level that would require processing to utilize it properly.
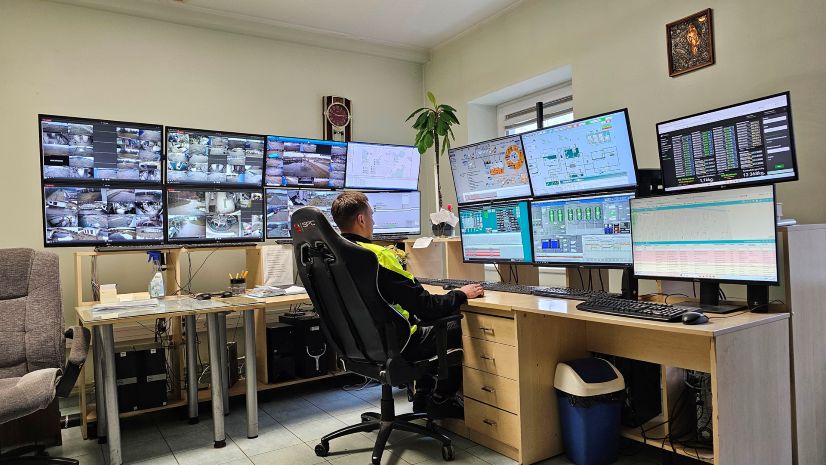
EVMWD’s IT efforts focused on ingesting and processing over one million data points daily. The raw data collected from the DCUs is first forwarded to a centralized data lake, where it is stored in its original, unprocessed state. The data lake functions as the primary staging area, enabling large volumes of data to be organized and prepared for downstream processing. From this point, the data would be structured and integrated with related datasets from the Customer Information System (CIS), Geographic Information System (GIS), and the Supervisory Control and Data Acquisition (SCADA) systems. The combined data streams would provide data for water production, customer consumption, reservoir levels, and system flow, which would result in the data for the comprehensive DMA data model. The data is further aggregated into weekly, monthly, and annual summaries to support efficient reporting and analysis. This approach was chosen by EVMWD’s IT to ensure timely access to meaningful information while maintaining the full detail of the underlying datasets. The data reaching this point meant that it could be accessed by others for development into applications for EVMWD staff to see the information with other context like CIS and GIS data.
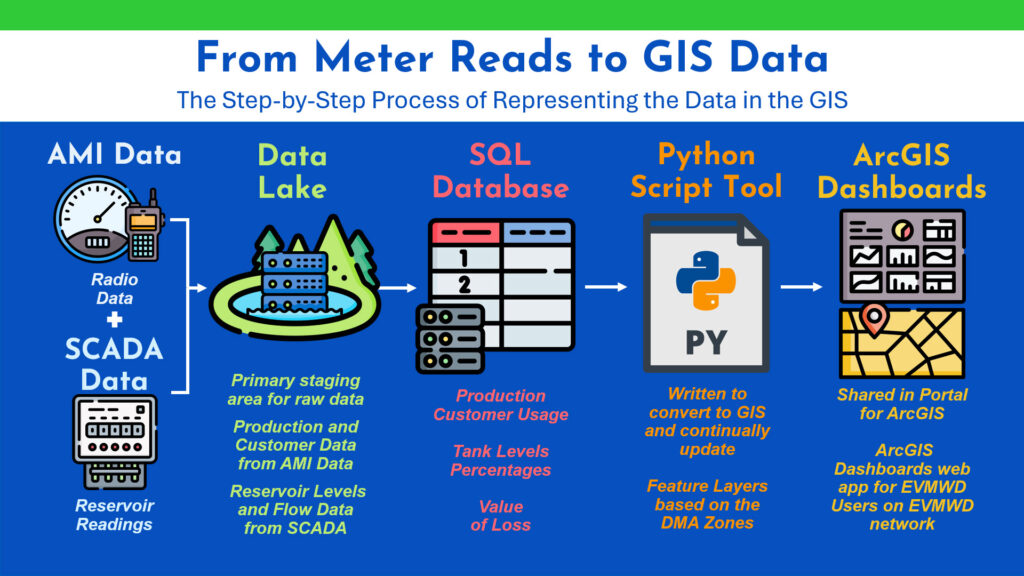
While this organized AMI data shows an analyst what is happening, it does not necessarily show the analyst where it is happening. Integrating AMI data with GIS helps answer that question. EVMWD’s GIS already provides an extensive spatial framework that helps users visualize the district’s water distribution system. These details are composed of nearly every stage of water movement, from treatment facilities through distribution and transmission pipelines into service laterals and ultimately to customer meters. This geographic context joined with the consumption data, flow, and facilities handling the water creates actionable information for users.
Developing Geographic Context for AMI
The integration of GIS and AMI began with the creation of an AMI team for handling this project. Anthony M Vazquez, the GIS Specialist at EVMWD, worked alongside Tim Collie, EVMWD Water Operations Manager, Ryan Johnson, EVMWD Water Systems Field Services Maintenance Superintendent, Haley Munson, former EVMWD Water Efficiency Coordinator, Brian Vigil, EVMWD Water Systems Preventive Maintenance Superintendent, Chuck Pollock, a previous employee of EVMWD and current DMA Consultant, and Kaitlyn Justus, a Fellow, along with support from Daniel Markham, IT Supervisor, and Darryn Flexman, Director of IT.
Development began with creating boundaries around EVMWD’s service area, known as district metered areas (DMAs). These DMAs were typically based on the reservoir facilities that provided water into the system and how those systems fed into EVMWD’s broader distribution network. In the GIS, data related to the water system provided two helpful fields for determining the build of these DMAs: the Water Audit Zone field and the Pressure field. Pressure Zone listings for water assets reflect portions of the distribution system operating within a controlled pressure range. These classifications are typically found to be an engineering-related boundary that’s associated with the highest reservoir elevation providing for this part of the system. In contrast, the Water Audit Zone listings are predefined sections of the water distribution system that account for water entering and leaving each section. These classifications are essentially a water operations boundary that helps with understanding where water may move or be lost within the system. The ability to dissect the service area and distribution network using these fields allowed EVMWD to create 22 DMAs and then begin work into the integration process one DMA at a time.
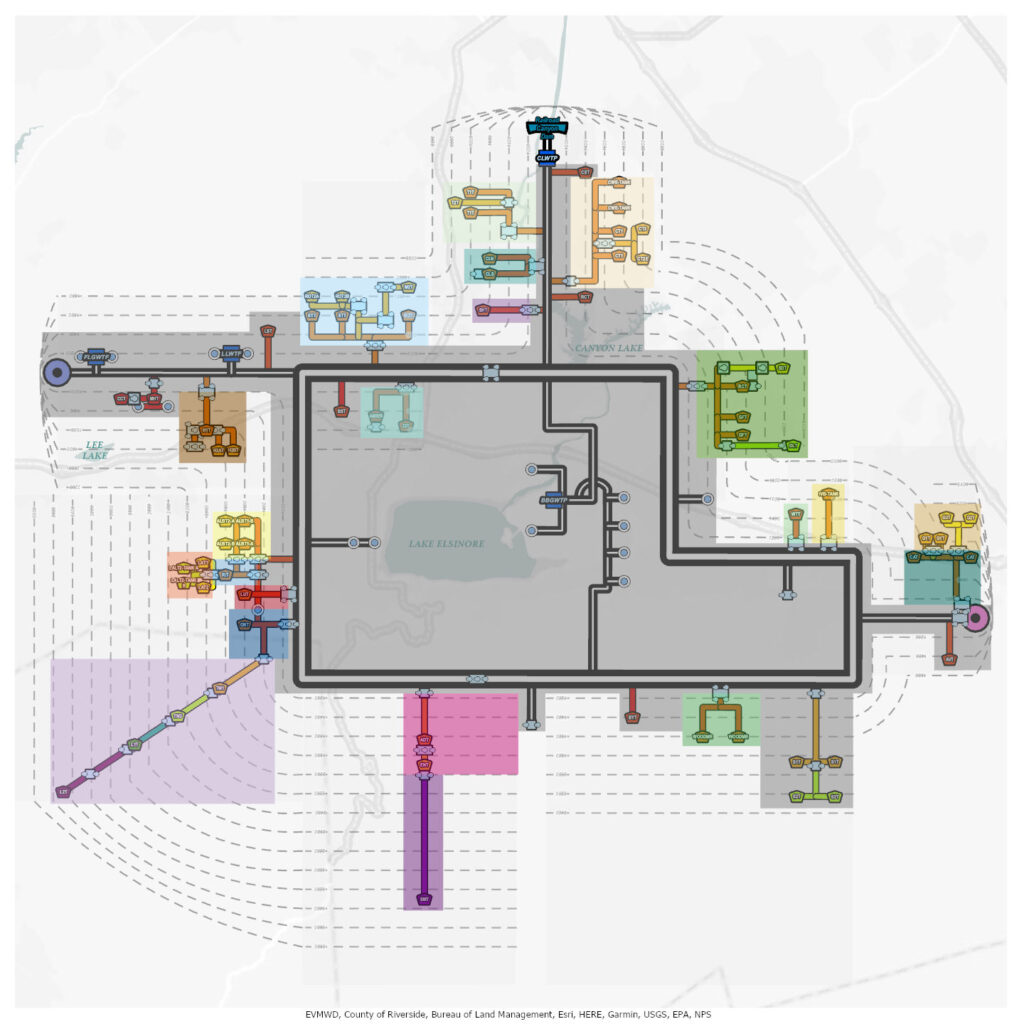
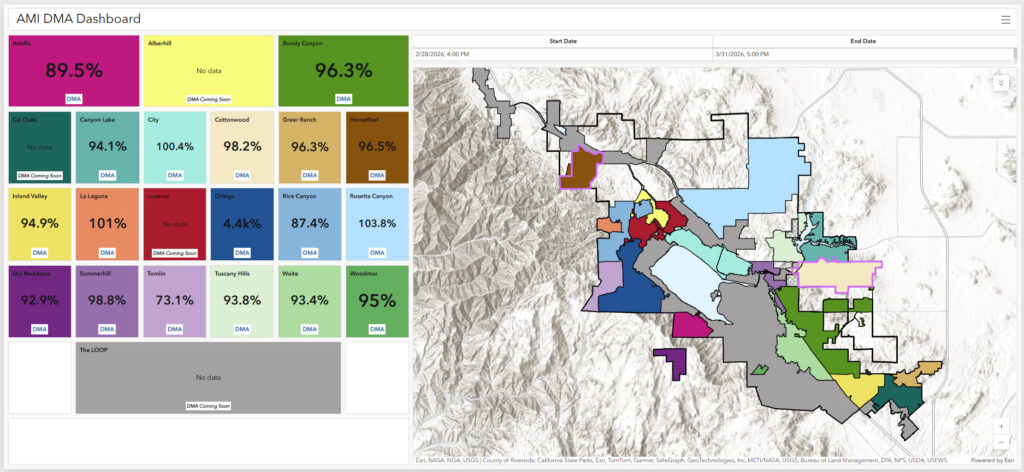
The next step in integrating AMI into the GIS involved developing applications. EVMWD’s GIS already utilized the connection between parcel data provided by Riverside County and live customer data in the CIS. This connection provided the framework for integrating data into an accessible application through ArcGIS Enterprise Portal. First, a Python script tool developed in ArcGIS Pro was utilized to update features that would include the reads from AMI data, such as the date of the data’s acquisition, water production, customer consumption, and tank levels. Two formulas were used. The first calculated water efficiency percentage by comparing customer consumption with water production and tank level adjustments. The second evaluated customer consumption relative to water production and changes in reservoir tank levels and incorporated current customer water rates to determine the value of water loss. These two new fields—Monthly Water Efficiency (%) and Monthly Value of Water Loss ($)—provided critical information that went beyond being just helpful information for the water operations team; they provided clear insight that EVMWD administration could use to make informed assessments.


The Importance of Water Efficiency and the Value of Water Loss
“There is no single silver bullet for identifying and eliminating all forms of water loss. A strong District Metered Area (DMA) program gives you the next best thing: clarity. By breaking the system into manageable zones, you can efficiently pinpoint leaks, identify under‑registering meters, and detect potential theft with far greater precision. This targeted approach dramatically reduces the manpower required to track down water loss and shortens the time from problem to solution.”
—Tim Collie, Water Operations Manager, EVMWD
The nature of working in GIS revolves around problem-solving, typically from a geographic perspective. When it came to integrating the AMI data into the GIS, the question became: What can the GIS provide us that the data could not? This has already been previously addressed: GIS provides the where. And, to finish that question, the water operations team wanted to know where in the system water loss was occurring. The purpose of this question was obvious: EVMWD’s pipeline network spans more than 760 miles, and if the district could narrow the focus to pipelines only showing noticeable water loss, this approach would save time, energy, and money during water loss investigations. Dividing the service area into DMAs and assigning each a monthly water efficiency percentage proved to be the best indicator for identifying efficient areas of the pipeline, allowing them to be crossed off the list of potential suspects of water loss.
When it came to analyzing the monthly water efficiency percentages, EVMWD learned that these could still be deceiving without an understanding of actual water loss in the region. During the early stages of building pilot DMAs in GIS, EVMWD identified a specific DMA, with just over 100 customers, showing a water efficiency percentage of approximately 88 percent. By calculations, this meant that this DMA had 12 percent water loss over that month, which EVMWD’s water operations team would consider poor and would require them to investigate known problems like faulty meters, pipeline leaks, or even water theft. The second formula—designed to determine the dollar value of water loss—provided EVMWD staff with enough insight that this was not a priority issue. With the area containing just over 100 customers, this 12 percent water loss ended up only accounting for roughly $300 of monthly water loss. From this information, EVMWD’s water operations team was able to make an assessment that the meters might need to be checked, but with more pressing issues happening across the water district, this was considered a lower priority than the monthly water efficiency percentage initially suggested.
AMI and GIS
“The preference of using ArcGIS Dashboards came from its ability to show the complex spatial data at its most necessary details. Our users now understand why the data matters, all from a quick glance.”
—Anthony M. Vazquez, GIS Specialist III, EVMWD
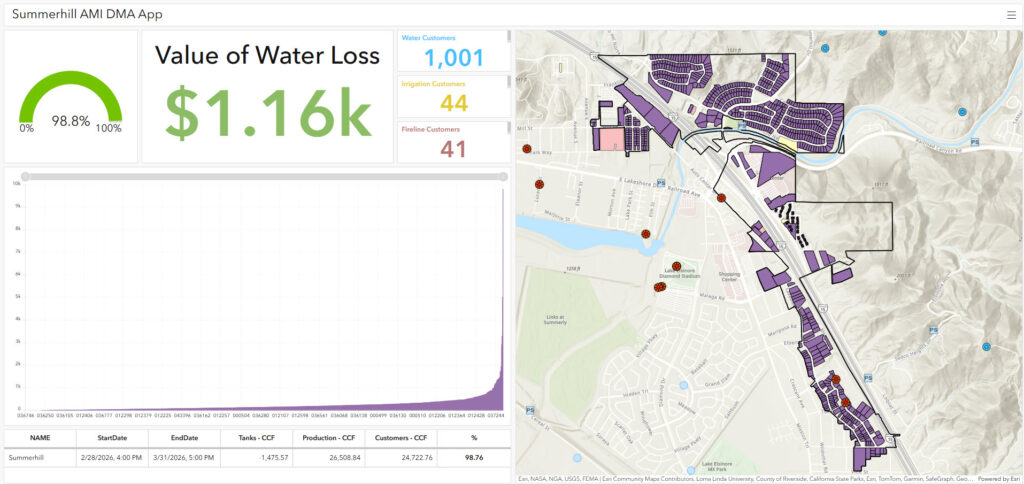
The goal of integrating AMI into GIS was to provide EVMWD’s water operations team with a dashboard that supports contextual and geographic understanding of the AMI data. During the development of the AMI GIS pilot project, three DMAs were chosen for boundary design, customer data review, and dashboard development. Although the data itself was already accessible in ArcGIS Pro from the custom Python script tool, the next step was sharing it to EVMWD’s ArcGIS Enterprise Portal and developing an application for staff use. The original concepts focused on creating one application that adjusted based on user-selected boundaries, but this approach was considered less than ideal for the overview of all active DMAs and supporting deeper analysis of individual DMAs to investigate the causes behind their values. The compromise was to create an overview AMI DMA dashboard with links under each DMA to a specific, more detailed dashboard focused on a single DMA’s data, all built using ArcGIS Dashboards. Simplifying the quick overview by only showing the water efficiency percentages was the priority, which gave the EVMWD water operations team an easy way to know focus areas based on the previous month’s data.
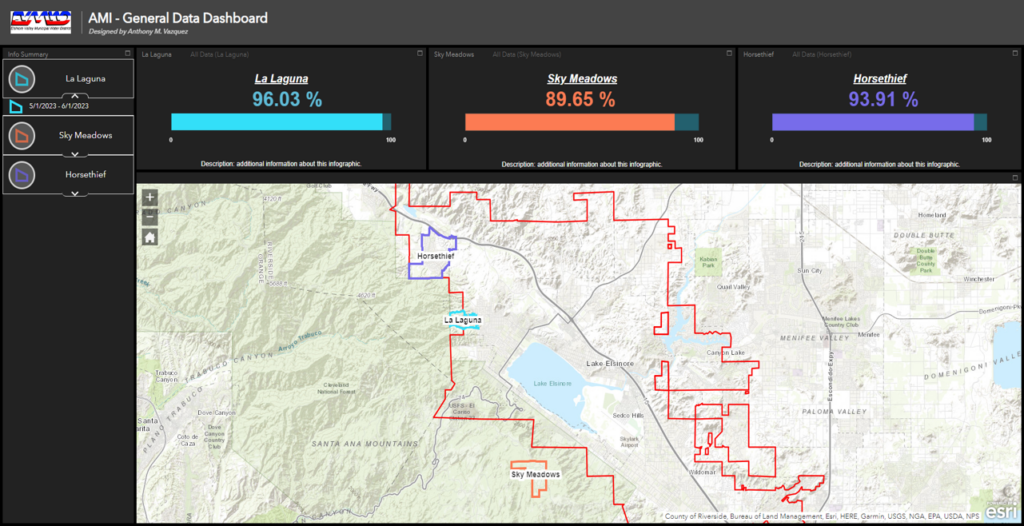
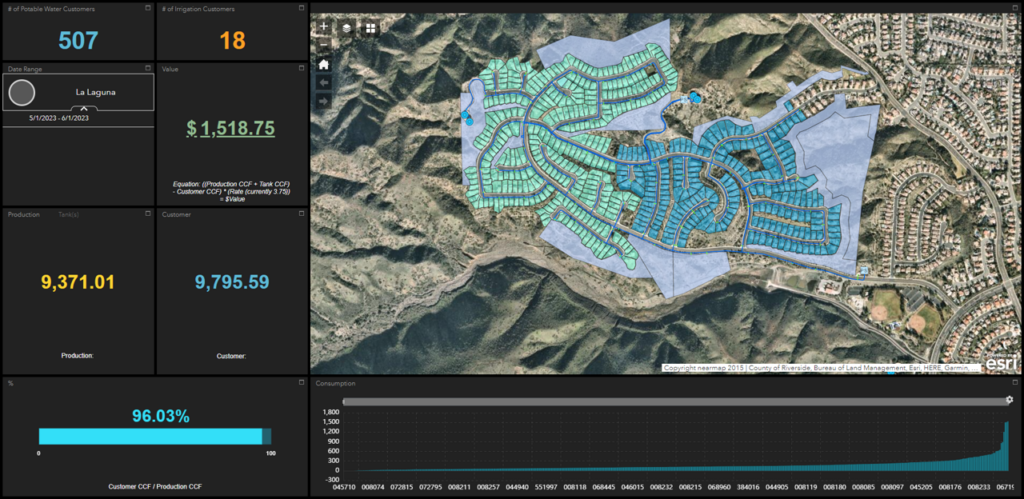

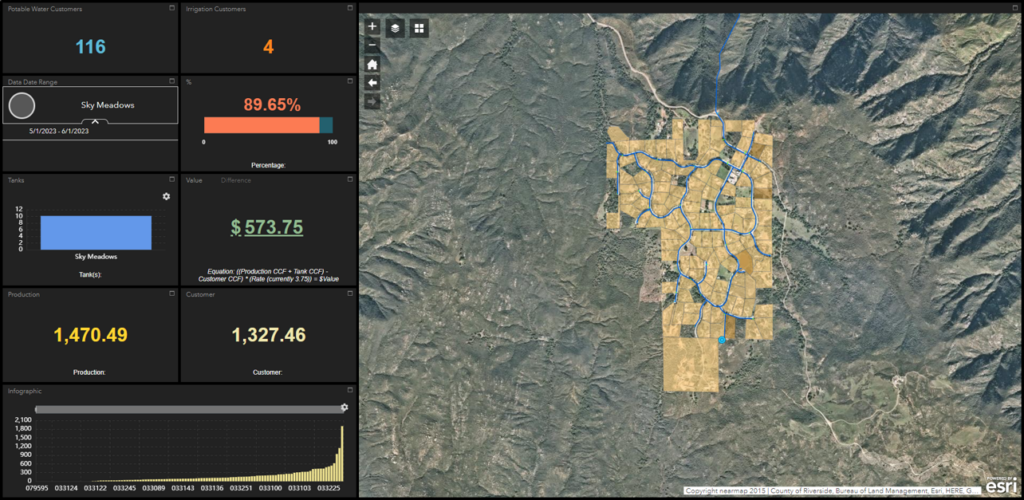
Directly following the pilot project’s success of displaying monthly AMI reads on the GIS dashboard, the concept of implementing a weekly system was proposed. While this venture would mean creating double the number of dashboards and a way to automate updating the data weekly, the compromise was tying that weekly data directly into the customer parcels already being displayed in the individual DMA dashboard map. Both the weekly values and the customer parcels shared the account number field, and it was simple to join these and provide a bar graph within the individual DMA dashboards to show the high-to-low users in a region. This capability also allowed the water operations teams to easily investigate potential faulty meters by either showing large amounts of water use or showing aging or damaged meters that may inaccurately report little to no customer use.
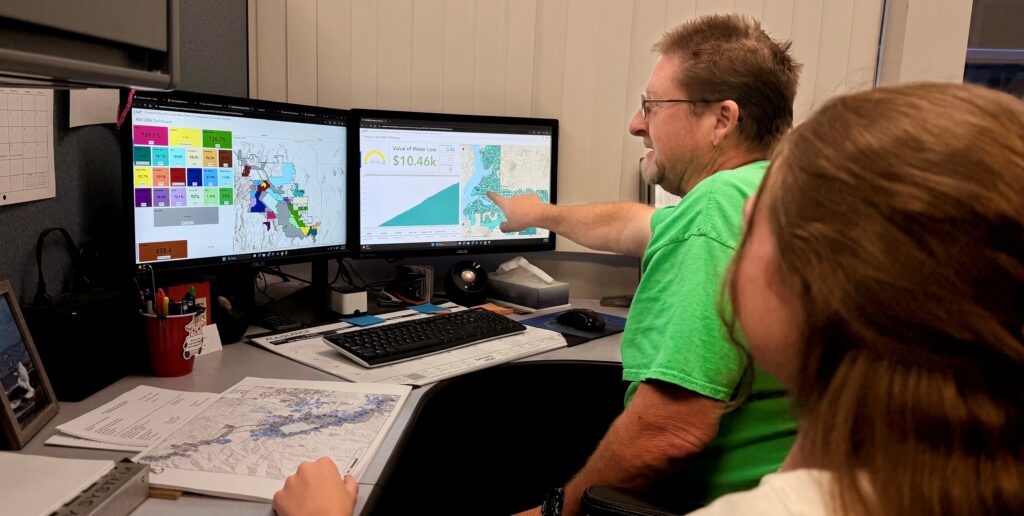
Altogether, the pilot project was considered a success by many within the administration, water operations, and IT of EVMWD. Each of these departments pushed for furthering the project into completing the integration for rest of the service area. Each new DMA has presented its own set of challenges for water operations, IT, and GIS, but the reward of the knowledge that these DMAs provide to EVMWD keeps those involved invested in seeing this integration thrive. As of April 2026, EVMWD currently has 18 DMAs working and displaying data on its GIS dashboards. The final four are set to be finished before the end of the year. The remaining focus will be maintaining data accuracy and ensuring applications continue to function effectively for the users.
Continuing Forward
“It is still a work in progress, but we are getting a much better handle on the enormity of the project. It takes a team to build an excellent DMA program and, step by step, we’re getting there.”
—Chuck Pollock, DMA Consultant, EVMWD
EVMWD has been impressed with the efforts made in the AMI integration with GIS. The goal is to finish the remaining parts of the service area and successfully bring AMI into GIS across all necessary locations. Another goal set for GIS is to integrate SCADA data related to facilities in each DMA. A direct understanding of the facilities involved would help departments like operational technology and water operations feel more invested in the complex details that AMI integration with GIS provides. The AMI team is optimistic in its approach of integrating AMI further into providing a better understanding of the water distribution network, along with even expanding the AMI implementation into EVMWD’s recycled water system. Many questions remain, along with opportunities to improve and expand the integration. Although the data source is finite, EVMWD sees significant and continuing potential in the insights gained through AMI integration with GIS.
For more information about EVMWD’s AMI team and the GIS integration process, contact EVMWD GIS Specialist Anthony M. Vazquez at AVazquez@evmwd.net. Learn more about EVMWD at www.EVMWD.com.

Stay Connected with Esri’s Water Team
ArcGIS is an extensive information system that enables modernization of workflows with easy-to-use applications. Strengthen your organization with geospatial solutions that will increase efficiency and provide insight for decision-makers. Visit the Esri Water Utilities web site for more information.
Join the Water Utilities Community
Follow #EsriWater on social media: X | LinkedIn
Subscribe to the Water Industry newsletter “Esri News for Water Utilities and Water Resources“