Since the launch of ArcGIS StoryMaps last July, the storytelling community globally has built thousands of stories for advocacy and outreach, education, and most recently, COVID-19 response efforts.
Read about how organizations are using ArcGIS StoryMaps for COVID-19 communication, get tips for effective storytelling, and learn how you can enable more storytelling across your organization with the new Storyteller role.
Stories That Make a Difference
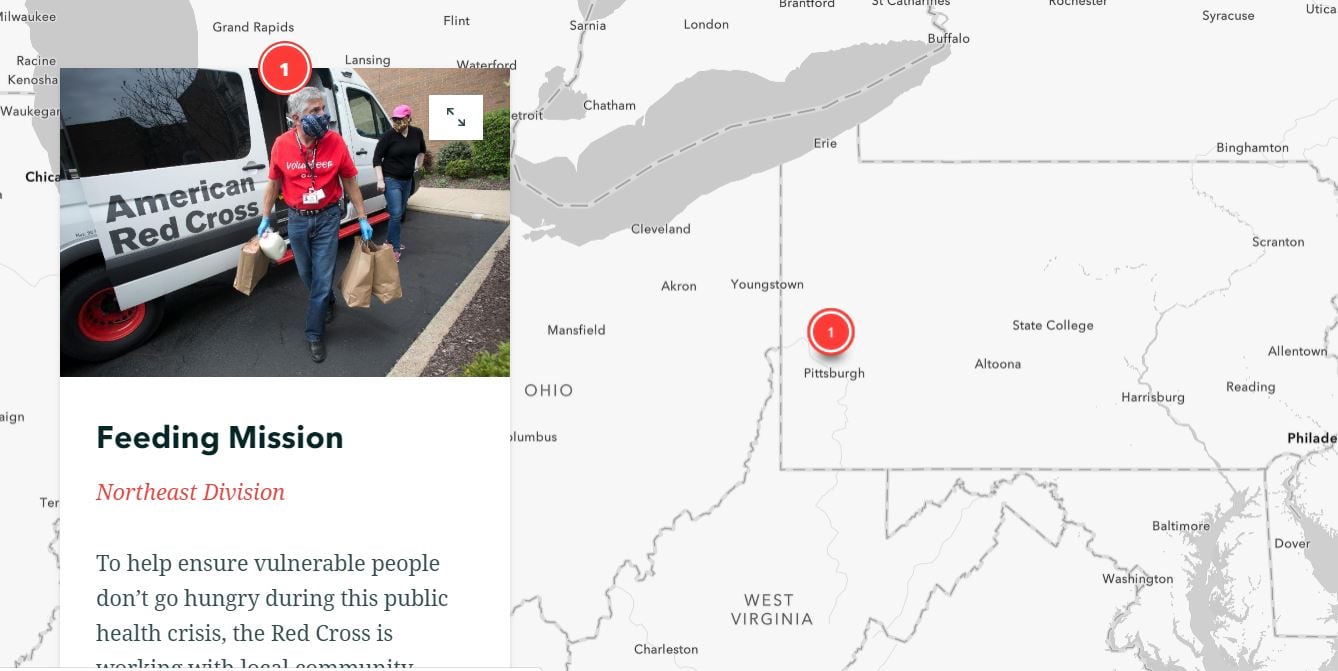
The Red Cross published a StoryMap that shows people where they can access resources.
They used the new Guided Tour feature to show how they are delivering meals to people who are vulnerable and highlight the story of a COVID-19 survivor who is donating convalescent plasma for people who are fighting the disease now. The Red Cross is also bringing awareness to their Virtual Family Assistance Center, which supports families who have lost loved ones.
By integrating the stories and photos of real people, the How the Red Cross is Helping People During COVID-19 story successfully highlights the ways in which the organization’s volunteer network and ongoing mission activities translate into community support during the COVID-19 pandemic. And the story emphasizes the organization’s scope and impact by displaying activities visually by location.
State and local governments are also using StoryMaps for a broad range of topics.
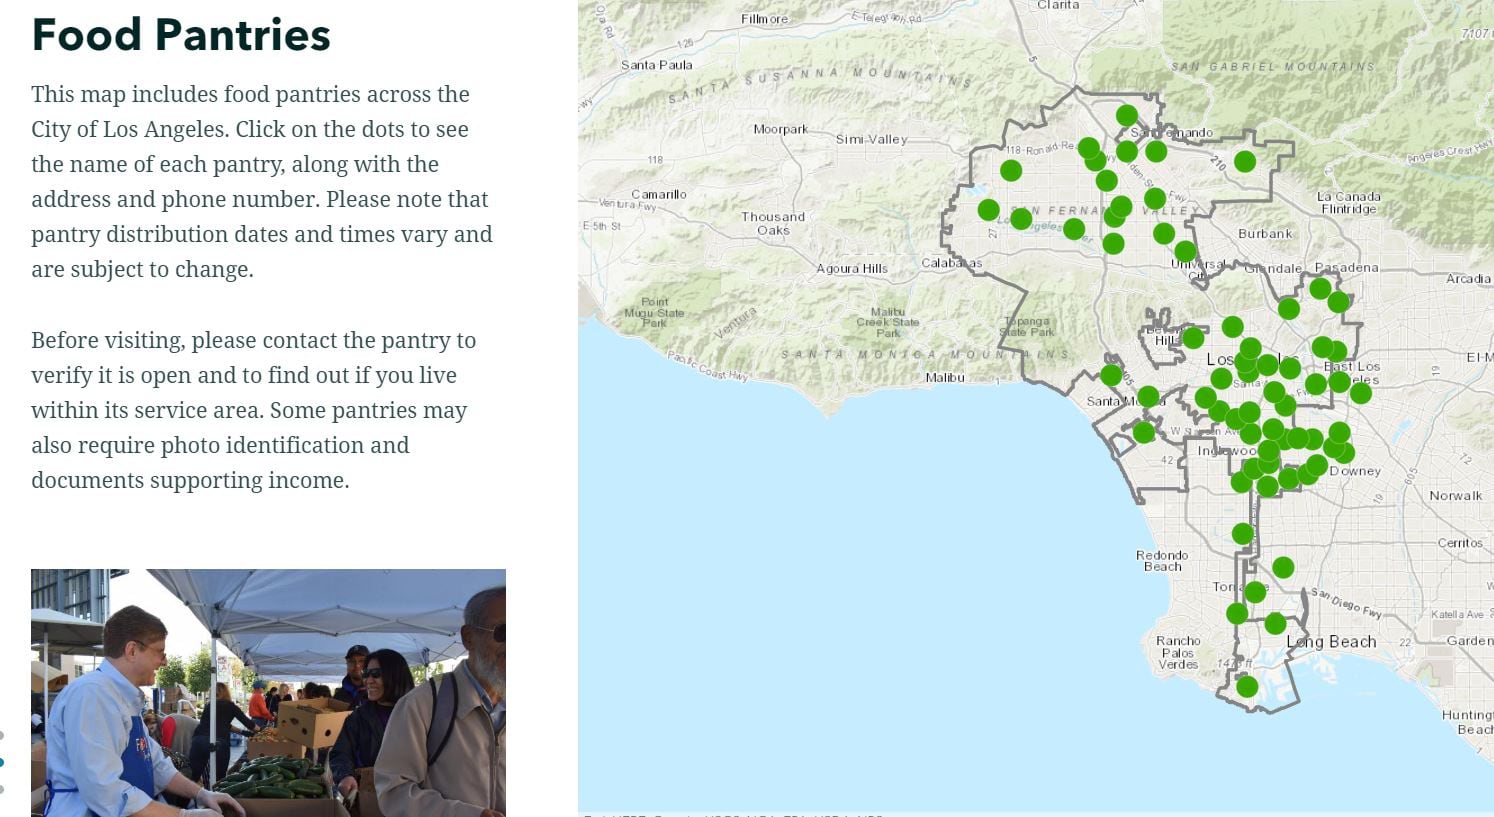
A frequent StoryMaps user for state agency projects, Los Angeles Controller Ron Galperin created a StoryMap to help constituents find fresh food in their area, serving a critical need for L.A. communities.

Using StoryMaps, we were able to connect people with free, nutritious meals to keep them fed and healthy. The response was so overwhelming that we followed up by building the first statewide food resource map, charting more than 1,800 food banks, pantries and distribution centers that serve every single California county.
Through interactive maps and helpful descriptions, Angelenos can find the closest food pantry, Los Angeles Unified School District Grab and Go center, and supermarket.
The three StoryMaps include a website or phone number for each food pantry, center, or supermarket so that residents can check hours and accessibility before leaving their homes.
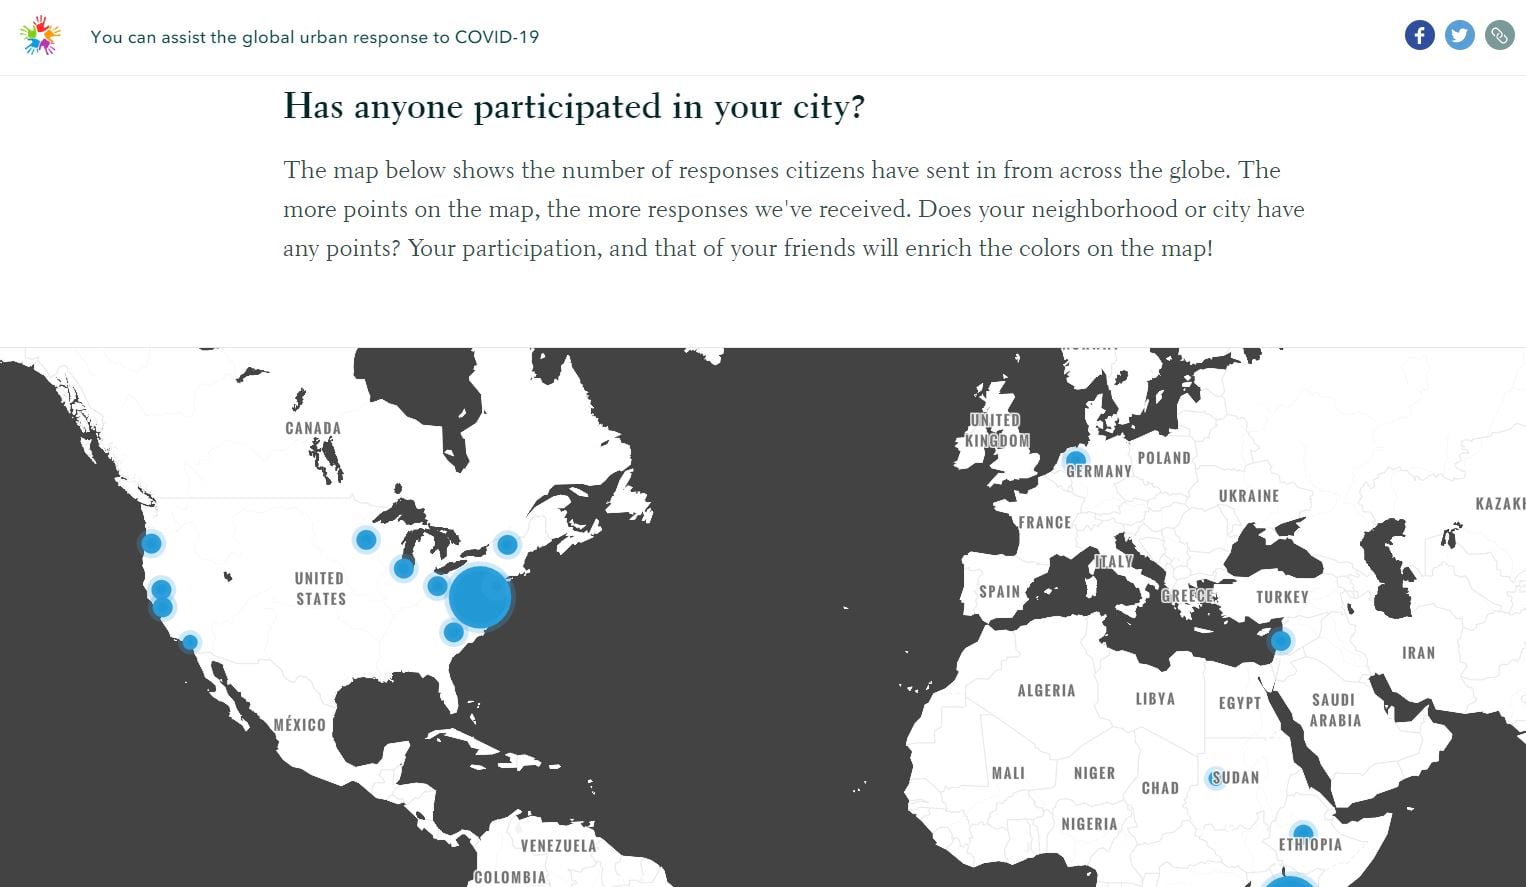
Around the world, we are seeing stories like this one from the United Nations, who is compiling data across hundreds of countries, provinces, and cities using a survey embedded within a StoryMap.
The simple questionnaire asks for information about the current situation in your city or neighborhood, the existing response measures, and emerging impacts from the pandemic to help paint a more accurate picture on what is happening in urban areas across the world.
The story displays participating communities on a world map, and UN Habitat provides participants with an I’M A CITY CHANGER image to share on social media.
Effective Storytelling is Key
With that in mind, it’s important to also remember that stories are what stick with people most. Maps, data, and visual content will get you off to a great start, but here are a few tips on how to tell a good story that will take your StoryMap to the next level.
Here are five tips for making effective and memorable stories:
- Organize your content before you get started. This blog article will help you ensure you’re set up for success.
- Spend time creating a compelling, clear headline for your story and make sure you have powerful photos or graphics that will draw readers in.
- Add a hero. Having a protagonist or main character in your story helps it resonate with readers on a personal level.
- End with a call to action. Stories are a great way to inspire action, so what’s the next step you’d like your reader to take?
- Don’t forget to share it widely! By creating a digital strategy for sharing your content, you can ensure all the right eyeballs land on your story map. Not sure where to start? This blog article shows you how.
To view the latest capabilities in this month’s release, check out the What’s New blog article.
Enable More Storytellers in Your Organization
With the new Storyteller role, you can enable more storytelling with ArcGIS StoryMaps across your organization.
Communications professionals, policy makers, and other non-GIS professionals can tell meaningful stories about the spread of COVID-19, locations of key health facilities, and actions citizens can take to reduce the disease’s impact. Create digital newsletters, interactive briefing materials and presentations, internal training materials, and so much more.
If your organization has a Creator or GIS Professional user type , you can purchase individual licenses for $100/year. Licenses can be purchased digitally through the Esri Store. The license allows each user to:
- Create ArcGIS StoryMaps
- Create express maps or embed shared content from your organization
- Share stories privately within your organization or broadly with the public
"With the new storyteller role, organizations can empower their communications professionals to use ArcGIS StoryMaps as a means of informing the public about about the spread of COVID-19, locations of key health facilities, and actions citizens can take to reduce the disease’s impact."
For more information on the Storyteller role, visit the blog or view our Pricing page.


Article Discussion: