About three weeks ago, Jack Dangermond, Esri’s founder and CEO, sent me a note saying, “I would like to know if you can do a story map of what our users are doing in response to the virus…”

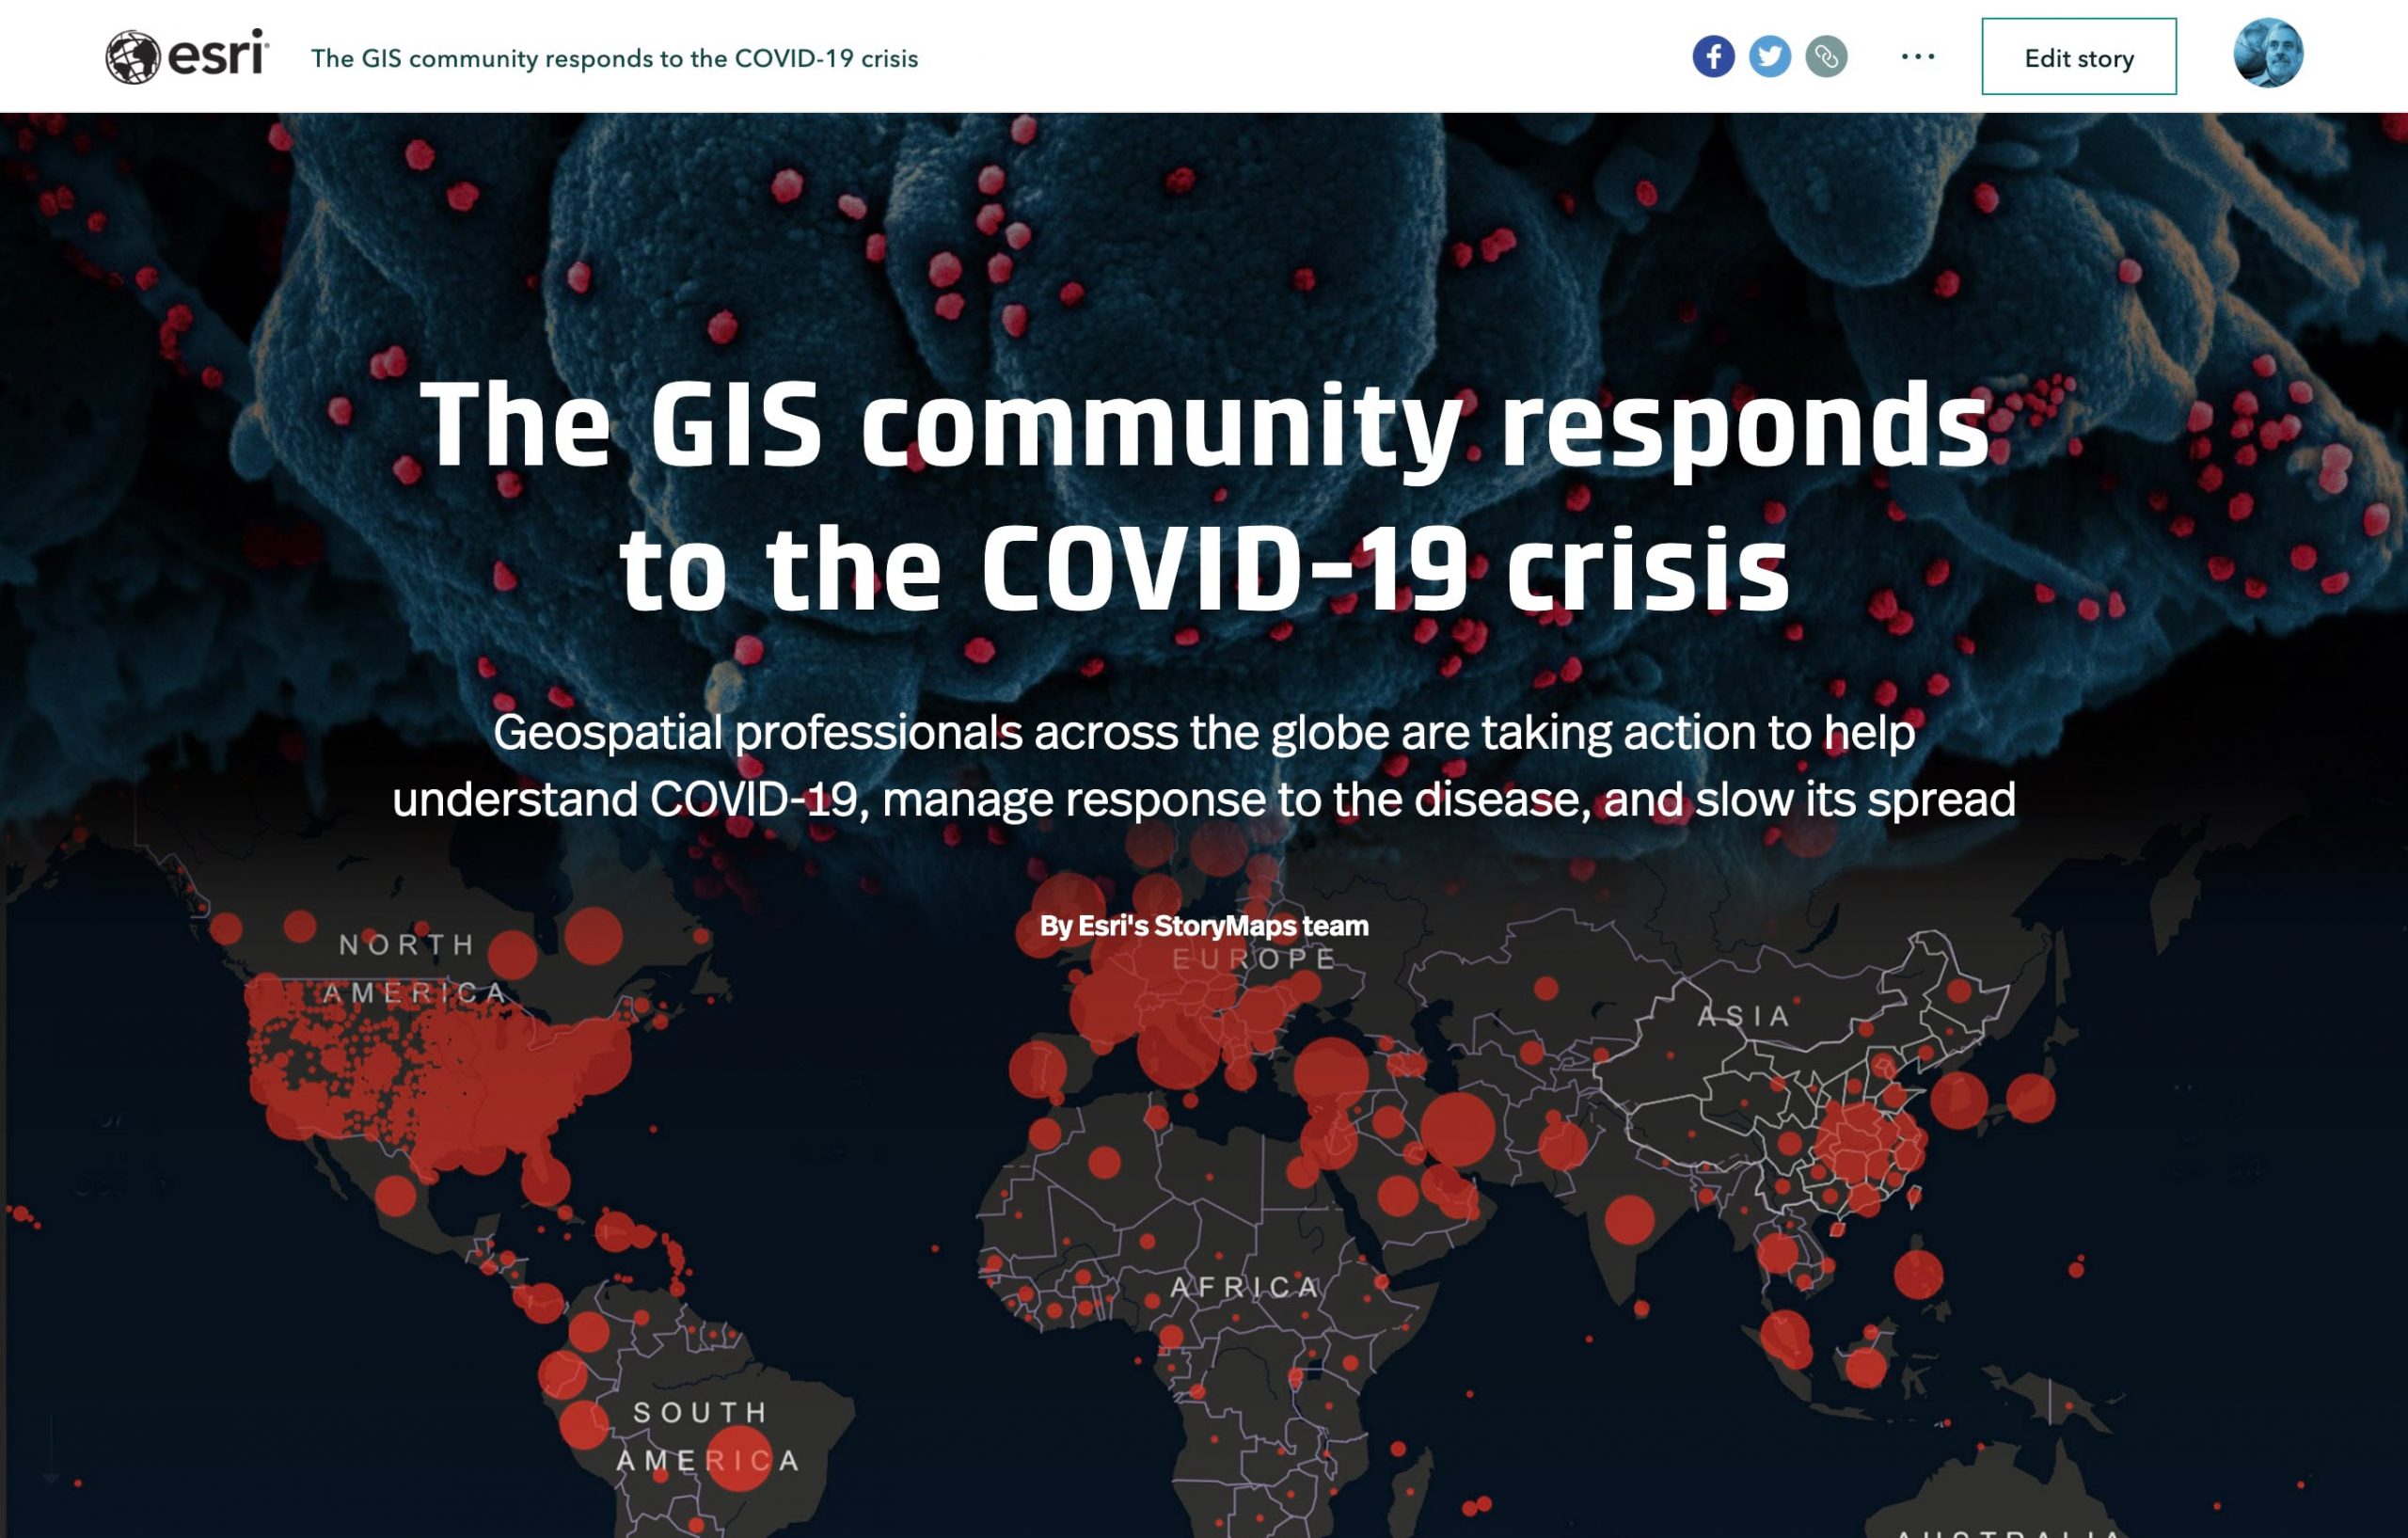
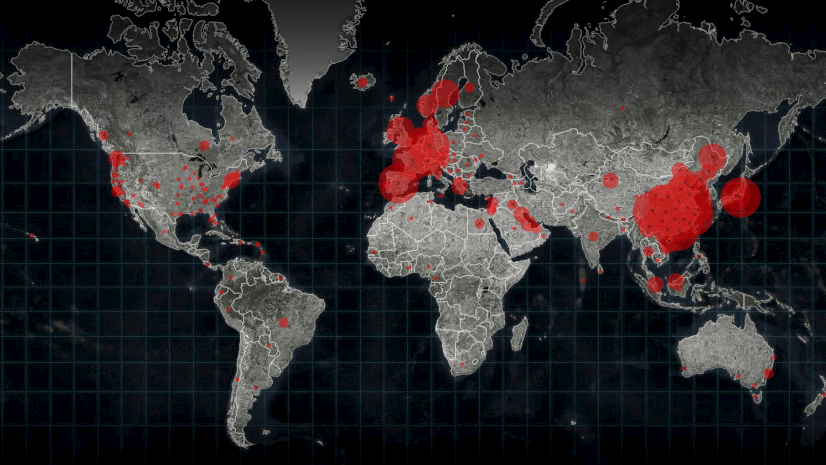
Today we published “The GIS community responds to the COVID-19 crisis.” The story map attempts to give an overview of the work of thousands of GIS professionals across the globe who are sharing data on unprecedented scales, and playing vital roles in providing desperately-needed insights to decision-makers about the spread of the disease and the means by which governments and other institutions can respond. Our story map barely scratches the surface of what amounts to a massive, common effort, with thousands of individuals creating countless visualizations, analyses, reports, and other data products.
A few things struck me as I was putting the story together; thus the items below. Perhaps you’re seeing the same sorts of phenomena.

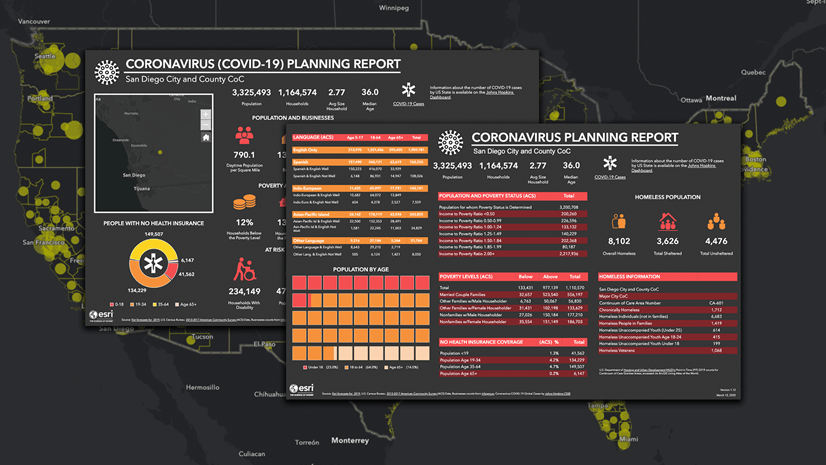
Literally thousands of hubs and dashboards have been published in the past few weeks. Behind those efforts, and largely invisible to the public, is the work of legions of GIS professionals, gathering data, performing analyses, and assisting responders in a variety of ways. Although their level of sacrifice pales in comparison to the medical workers on the frontlines of the pandemic, their work is, in its own way, heroic.

As the pandemic evolves, we’re witnessing the weaving together of multiple strands of information into a fabric of response that spans scales from global to local, and crosses hundreds of jurisdictions. We’re seeing a degree of collaboration that’s unprecedented, from the planet-spanning efforts of the World Health Organization to local hubs and dashboards hosted by innumerable municipal, county, and regional agencies. For years now, geospatial visionaries have been touting the concepts of web GIS. The spring of 2020 has witnessed its arrival.

Those of us who are old enough to have lived through the dawn of the digital age can easily recall how painful things could be in those early days: hulking, room-sized computers—less powerful than our iPhones—crashing beneath the weight of even simple tasks; poor, inaccessible, or nonexistent data; the tedium of digitization; opaque, command-line software.
We still complain about lack of data, and we still seek more powerful computers. But in every way, we’ve arrived—we’ve weathered the transition and now enjoy the fruits of decades of innovation. Data, processing power, and networked computing have enabled massive, joint, global efforts. If there’s any remaining hurdle to fully accomplishing web GIS, it’s the inertia of institutions and our own failure to imagine and accomplish what these technological miracles have made possible.

GIS used to be almost entirely a back-office phenomenon, with highly-trained professionals quietly laboring away using software and techniques only vaguely understood by the rest of us. The insights gained from their work benefited decision-makers within organizations, but only occasionally reached larger audiences, and even then only as abstruse, static reports and posters. Suddenly GIS is as much about communication as it is analysis. Apps and resources like ArcGIS Online, ArcGIS Dashboard, Survey123, and ArcGIS StoryMaps have turned GIS workers into communicators. GIS has burst out of the back office and has become accessible and actively used throughout organizations—and beyond.

For two decades I’ve eagerly attended the annual Esri User Conference. Although they’re exhausting affairs, I’m invariably inspired and energized by the quiet but palpable sense of common purpose that suffuses the crowded hallways, packed technical sessions, and buzzing exhibition floor. The thousands of professionals attending the conference use GIS in myriad ways, from warfighting to infrastructure management, from protecting natural habitats to building smart cities. Regardless of the specialty, there’s a quiet pride in knowing that they’re making their organizations more effective, and that they’re serving a larger, common good.
That same, subtle ethos underpins and energizes the ongoing efforts by geospatial professionals to help conquer COVID-19. Maybe it’s just me, but—looking at the countless maps, dashboards, hubs, and other pandemic-related resources—I sense the same shared passion, in this case urgently focused, in common cause, to save lives and reduce suffering.

As I mention in the story map, millions of us are experiencing social distancing, yet—ironically—the COVID-19 crisis is underscoring our interconnectedness and interdependence. For better or worse, we’re a global community, and that means we need to work toward understanding, planning, managing, and responding to global issues with as great a degree of collaboration as our diversity of viewpoints and backgrounds will allow.
It’s human nature to fail to fully anticipate crises before they occur. We now realize that better planning would have dramatically reduced the impact of COVID-19. It’s also in our nature to learn and grow, and to apply the lessons of one painful experience to reduce the impact of potential future threats. The ongoing work by tens of thousands of geospatial professionals is laying the groundwork for a more effective response not only to future pandemics, but to other issues that pose potentially even greater dangers.
GIS holds the promise of being a central component of a global network that can sense threats, map their extent, and help implement solutions. Climate change, environmental sustainability, and reduced biodiversity are three such global, existential threats. The great silver lining of the COVID-19 crisis is the possibility that we can apply the lessons we’re learning even more broadly, with the ultimate and essential goal of achieving a sustainable and peaceful future.


Article Discussion: