
About the author: Brian Tomaszewski, Ph.D., is a Geographic Information Scientist whose interests lie at the intersection of GIS, natural disasters, and forced displacement. He is passionate about how GIS can be used to empower people faced with challenging situations. He is an associate professor at the Rochester Institute of Technology located in upstate New York, USA. He runs the Center for Geographic Information Science and Technology, which conducts international research projects in the USA, Germany, Rwanda, and Jordan.
_______________
When it comes to opportunities for refugees to find new skills and livelihoods to rebuild their lives, Za’atari refugee camp is one of the most innovative camps in the world. Located in northern Jordan, today approximately 80,000 Syrian refugees live in Za’atari.
The conflict these refugees fled has created a protracted forced displacement situation—millions of Syrians now live as refugees all over the world. In fact, a recent report released by the United Nations High Commissioner for Refugees (UNHCR) indicated that, worldwide, refugee and displaced population numbers continue to grow at levels not seen since World War II.
Seventy-eight percent of all refugees globally have been in exile for five or more years and the number of protracted crises continue to increase year on year. Given this, one of UNHCR’s priorities is increasingly to invest in livelihoods and education for those whose lives have been up-rooted. In Za’atari, where the majority of refugees arrived in 2012 and 2013, developing refugee’s skills is now more important than ever.
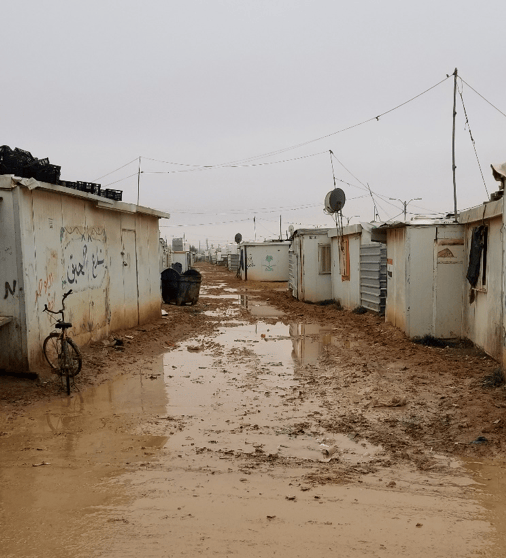
Empowering refugees with GIS
In 2016, I co-founded the Refugee Geographic Information Systems (RefuGIS) project along with UNHCR. This was the world’s first effort to teach GIS to refugees, and its purpose was to support humanitarian operations while creating livelihood opportunities for refugees themselves. I first published about the RefuGIS project in the summer 2017 issue of ArcNews.
Since the project’s founding, several RefuGIS refugees have gone from no background in GIS to becoming very proficient in a variety of GIS concepts and Esri technology, including ArcMap, ArcGIS Pro, and Collector for ArcGIS. In 2019, the RefugGIS project began to explore the power of online mapping and Esri Story Maps in particular.
Story maps have been created about refugees in the past. But, to the best of my knowledge, not by refugees themselves—especially those living in a refugee camp. But stories abound among the refugees living in Za’atari. Every person has a powerful story to tell about their journey fleeing Syria, and how their life in the camp has unfolded in the nine years since the start of the conflict. The time was ripe for the refugees of Za’atari camp to start telling some of their stories through Esri’s storytelling technology.
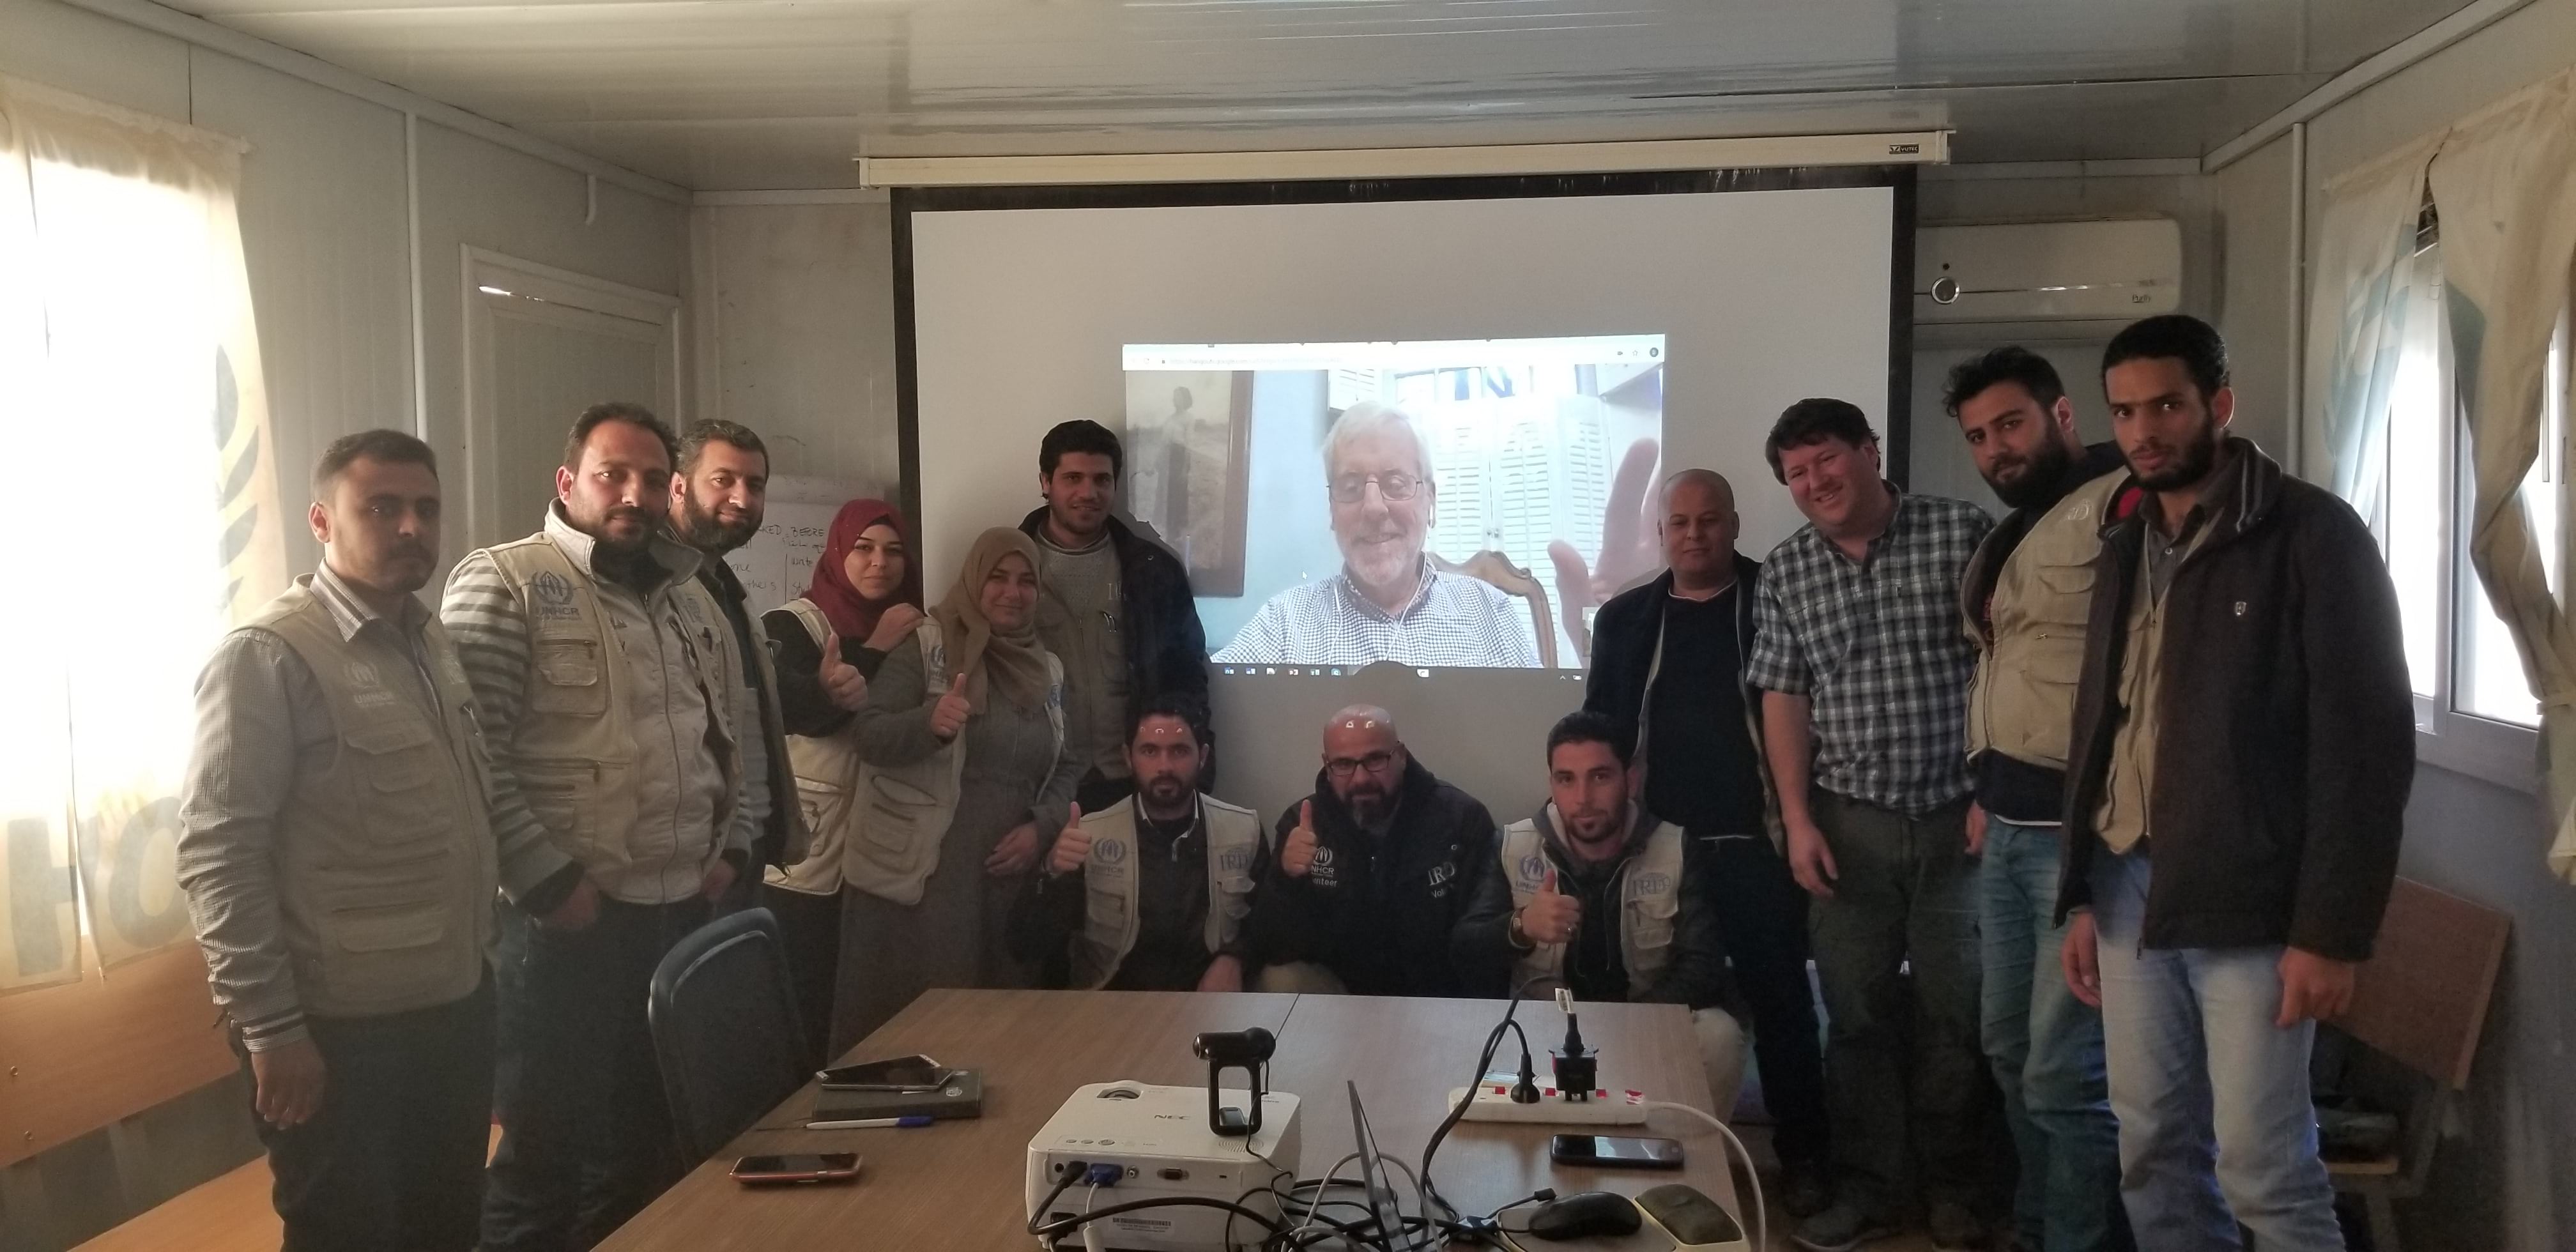
Connecting with the team behind Story Maps
In early 2019, I spent five weeks in Za’atari camp as part of a sabbatical from the Rochester Institute of Technology. My goal was to teach the refugees of the RefugGIS project how to create stories with Story Maps. It was also fortunate that a 2018 article I’d published in The Conversation had been viewed by Allen Carroll, founder of the Story Maps team. Allen contacted me about the project and generously offered to support the RefugGIS team in creating story maps.
Over a period of about three weeks, we held several virtual training sessions between Za’atari Camp in Jordan and the East Coast of the United States. With a 7-hour time difference, Allen and his colleague Greyson were very kind to wake up early in the morning (7am!) in order to do virtual calls with the team in Jordan.
The refugees were very quick to pick up on the concept of story maps, and generated several interesting pieces that ranged from the experiences of women in the camp, to educational efforts in the camp, to camp water resources. As their GIS teacher and mentor, I was particularly happy to see how all of their existing GIS skills were being used. Refugees even began to move further into the ArcGIS Online realm, creating web maps that they then included in story maps.
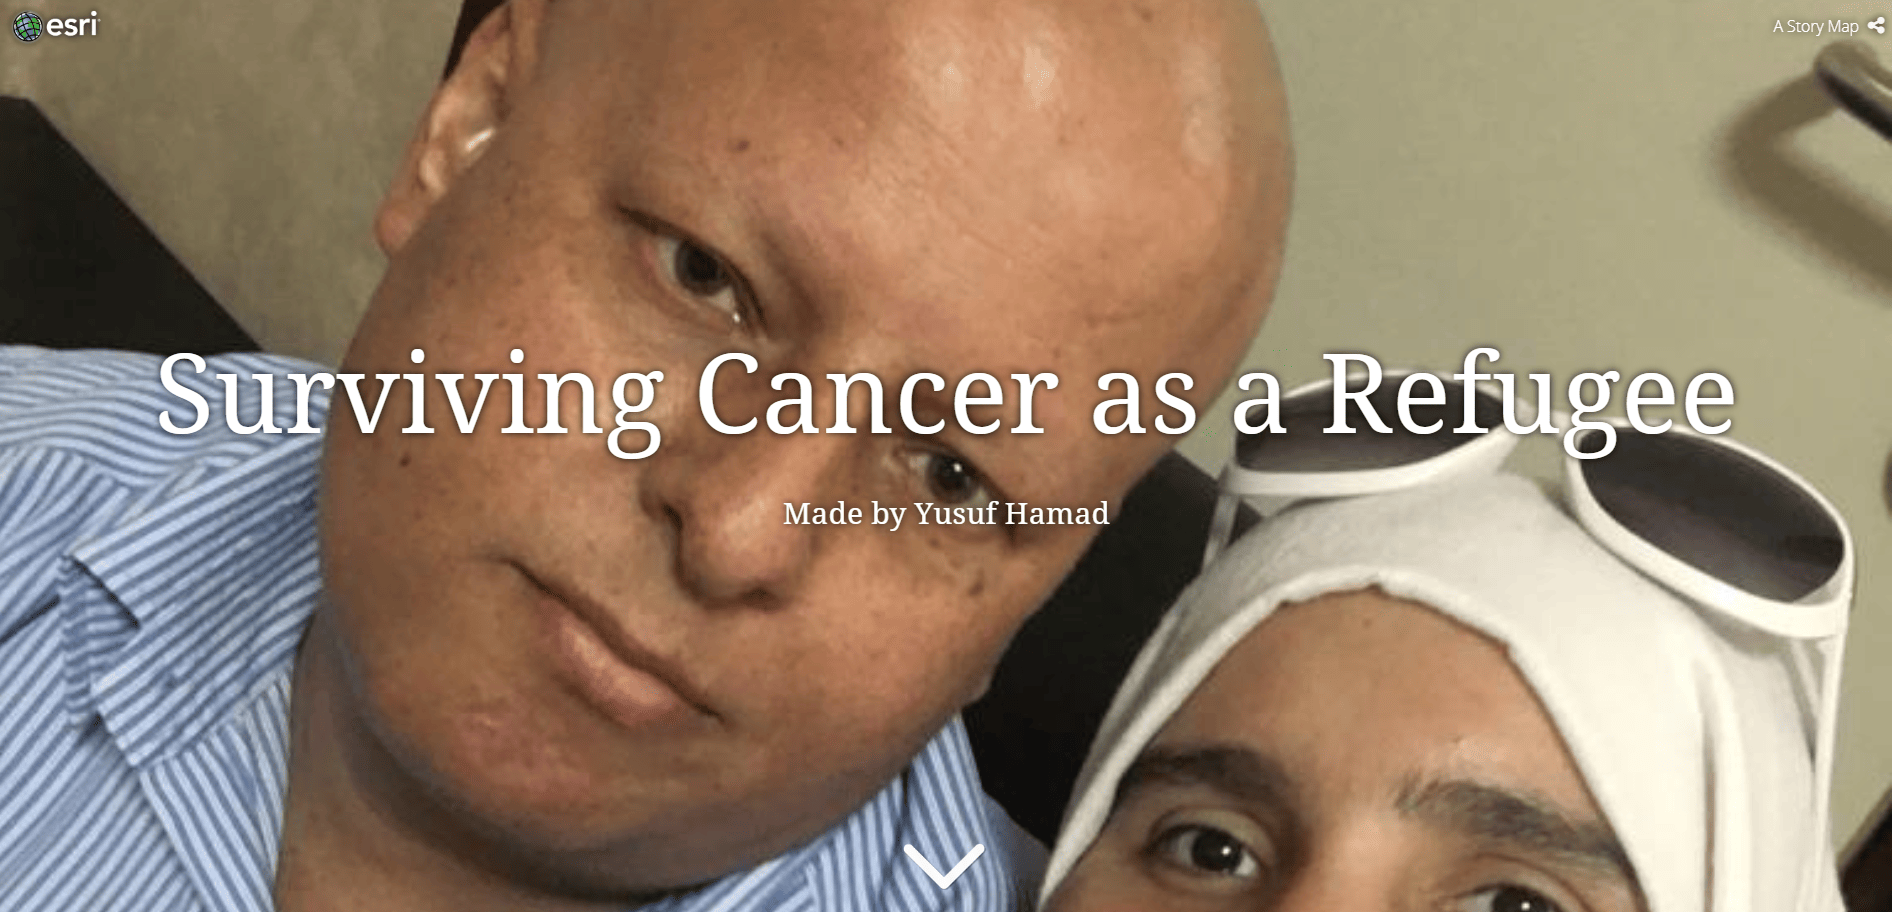
Yusuf’s story
One particular story map that really stood out form these efforts was one created by RefuGIS team leader Yusuf Hamad. I’ve known Yusuf since my first time coming to the camp in 2015, and he is one of the best GIS students I’ve ever had. From the very beginning of RefuGIS, he very quickly mastered basic GIS concepts and demonstrated an insatiable appetite to learn more and more about GIS and related technology such as python programming and data analysis.
Unfortunately, Yusuf was diagnosed with cancer in 2016. He has been fighting a courageous battle ever since. Yusuf decided to use Story Maps to share his experiences as both a refugee and cancer survivor.
Leveraging Story Map Cascade, Yusuf uses interactive maps to show his journey from war-torn Syria to the Za’atari refugee camp in Jordan. He also describes what it was like to live in the camp in the early days by integrating photos alongside the map. The story then becomes very personal as he describes how he met his wife in the refugee camp, which led to the birth of their two beautiful children.
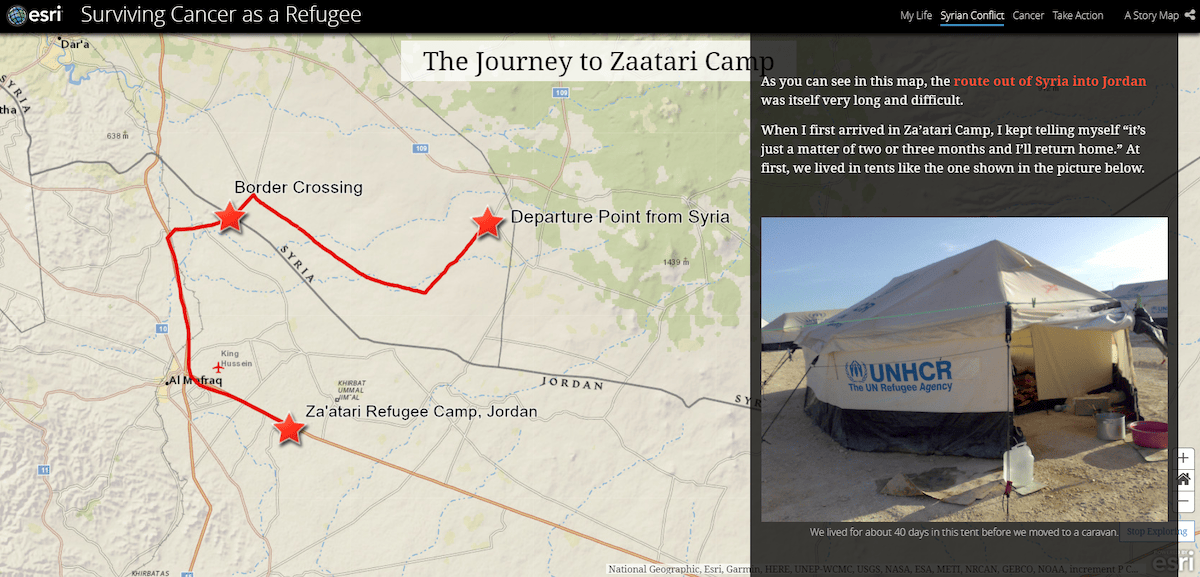
His story goes on to describe the agonizing and difficult process of dealing with cancer treatment while living in a refugee camp. Challenges range from lack of money for treatment, to the very long journey to treatment facilities in Amman, Jordan.
Yusuf’s story map is a compelling narrative about the life of one individual refugee dealing with challenges of forced displacement and surviving cancer, but it also represents his development as a GIS expert—as evidence by the use of integrated maps, pictures, and narrative to show how he survived the journey out of war-torn Syria.
To me, the story behind Yusuf’s story map demonstrates the power of the human spirit to learn new skills, like GIS and digital storytelling, and to use those skills despite hardship. Empowering refuges to tell their own stories with Story Maps can help bring advocacy and attention to the broader story of human populations around the world that are facing extreme challenges because of forced displacement.



Article Discussion: