Construction Safety Week 2026 calls on the industry to go All In Together by focusing on three pillars – Recognize, Respond, and Respect, to help prevent serious injuries and fatalities across high energy, high hazard work environments.
This week will be filled with safety stand downs, and it’s a week for extra reflection on what is said during them. Construction incidents are very rarely a single point of failure, but rather a chain of events where any singular action could have prevented it. Unforeseeable accidents can and will happen, but all too often avoidable events are in that category.
Some years ago, a delivery driver was killed when a loose tape measure was kicked over the edge of a 50 story building, bounced off another object, ultimately landing on his unprotected head. The news called it a freak accident, but it could have easily been a preventable incident.
When we all Recognize, Respond, and Respect, we go home in one piece. This year we’ll talk a bit about the tech that can help across the entire project team and together, improve performance in all three pillars.
As construction projects grow in complexity, technology plays an increasingly important role in supporting teams on and off the jobsite. ArcGIS Velocity and the ArcGIS platform provide the tools needed to turn real‑time data into actionable safety intelligence. ArcGIS Velocity delivers real-time data integration and analytics capabilities, empowering organizations to ingest, analyze, and act on streaming data from virtually any source, including IoT sensors, moving assets, and event streams.
Recognize
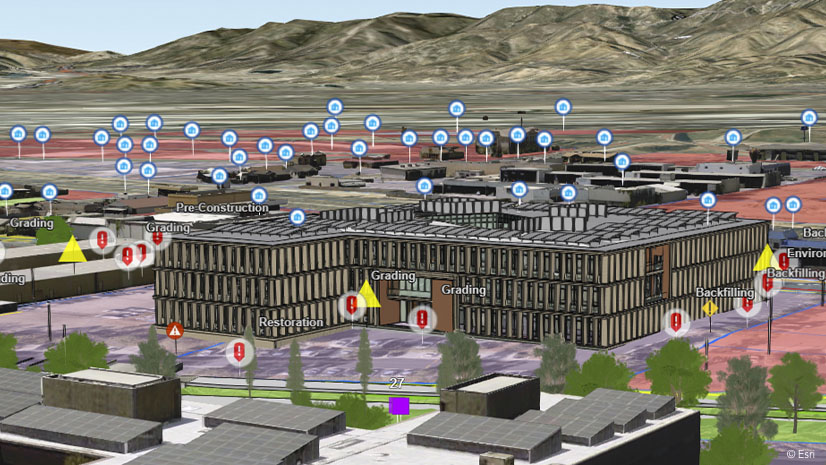
The first pillar, Recognize, focuses on the presence and impact of high energy / high hazards and STCKY (stuff that can kill you). The importance of having a common framework for early identification of these hazards is essential in ensuring workplace safety; the Esri ecosystem provides that framework by basing hazard identification in spatial location and real-time data, and recognizing hazardous conditions as they emerge.
Vehicle Tracking and Employee Location Awareness
Almost everything has a sensor and location these days – from equipment to vehicles to mobile devices. Using ArcGIS Velocity, organizations can create feeds to continuously ingest live data from these sensors, perform analysis as the data is received, and ultimately better understand what is happening on a job site right now, not hours or days later. Project teams can stream GPS and telemetry data from vehicles to detect speed and idle time in sensitive areas, and traffic congestion which can lead to delays in delivery.

While on the jobsite, employees can be notified instantly if they get within a certain distance of a restricted zone, allowing them to avoid dangerous situations before they occur. Combine employee location monitoring with vehicle tracking and new insights are unlocked, such as detection of repeated crossings between worker paths and delivery paths, and potential high-speed interactions with workers. This takes hazard recognition from a static checklist to a continuous, data-driven process.
Respond
Once hazards have been recognized, the next step is to respond. This second pillar focuses on communication when events do occur, and putting controls in place.
Real‑Time Awareness for Rapid Safety Response
Weather is one of the most unpredictable and dangerous variables on a construction site. Real-time weather data can be ingested from a variety of sources and data such as wind speed, lightning proximity, or extreme temperatures can be evaluated against pre-determined safety thresholds.
When conditions exceed safe operational limits or dangerous weather conditions are expected to impact a site, alerts can be created to notify site supervisors, trigger field notifications, or update dashboards immediately. For activities like crane operations or lift planning, these instant insights can mean the difference between a workplace incident and a life‑saving decision.
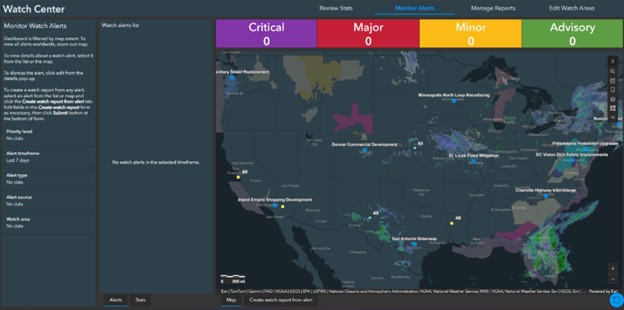
Velocity acts as the real-time engine behind the scenes and integrates seamlessly with ArcGIS Dashboards and ArcGIS Experience Builder to present a common operational picture for safety managers, field supervisors, and executives alike. Stream Layers generated in the engine can be added to maps, charts, and indicators to show what is happening across one site or an entire project portfolio – environmental conditions, vehicle activity, worker locations, and open safety events all in one centralized source. This holistic view supports faster decision making and helps ensure everyone is working from the same trusted information in moments when speed and clarity matter most.
Automated Workflows in the Office and the Field
Beyond visualization, Velocity can trigger automated actions in business systems you already use when defined conditions are met. These workflows might include sending notifications to field crews, starting a safety incident report, updating internal tracking tools, or pausing downstream processes until hazards are resolved. This automation minimizes delays and supports standardized responses across projects.

Respect
The final pillar, Respect, focuses on learning from previous incidents and preventing future mistakes. This is where historical geographic data is key.
Analyze Trends Across Projects and Move from Individual Incidents to Organizational Knowledge
By saving historic safety observations, incidents, near misses, and operational data into a single system of record, big data analytics can be created to perform on-demand or scheduled workflows on previously collected data. Organizations can move beyond isolated “lessons learned” moments and discover patterns over time, identifying which types of work, locations, or conditions consistently present higher risk. This helps answer questions such as “Do incidents spike during certain phases of construction, with specific equipment, during certain times of day, or under certain environmental conditions?” with clarity and precision.

We recognize this is a dangerous industry, but also that we sometimes become complacent. Construction Safety Week 2026 highlights the industry’s shared responsibility to improve jobsite safety and conditions across all roles and responsibilities. Identifying technology to assist throughout the project lifecycle is a step toward a future that embeds safety into daily operations and strengthens safety culture for the industry.
Ultimately, each data point in a database represents a real person, a real life-altering event, and an opportunity to improve. That’s why this week is so important – it’s a week to remind us that our jobs don’t carry a normal level of risk, and that each of us are critical on the jobsite and at home. Perhaps most importantly, it’s a reminder that this is a mindset we need to uphold throughout the year, so that we can all continue to go home to our families at the end of the day.
To learn more about Esri’s solutions for Construction, read more here.