Situated 25 kilometers west of Latvia’s capital, Riga, Jūrmalas ūdens is the municipally owned water and wastewater utility serving the coastal city of Jūrmala. The utility delivers potable water to over 55,000 permanent residents—and serves a summer tourist population exceeding 100,000 people—across more than 1,000 kilometers of water and sewer networks. Each year, it produces 3.1 million cubic meters of drinking water and treats 2.9 million cubic meters of wastewater with a team of more than 140 employees.
Since the early 2000s, Jūrmalas ūdens has invested more than €145 million to reach 99 percent service coverage. The utility has been formally recognized by the International Water Association’s Climate Smart Utilities (CSU) program. Today, Jūrmalas ūdens is embracing this role—using geographic information system (GIS) technology, analytics, and renewable energy to advance the CSU principles of sustainability, resilience, and digital transformation.
The Challenge
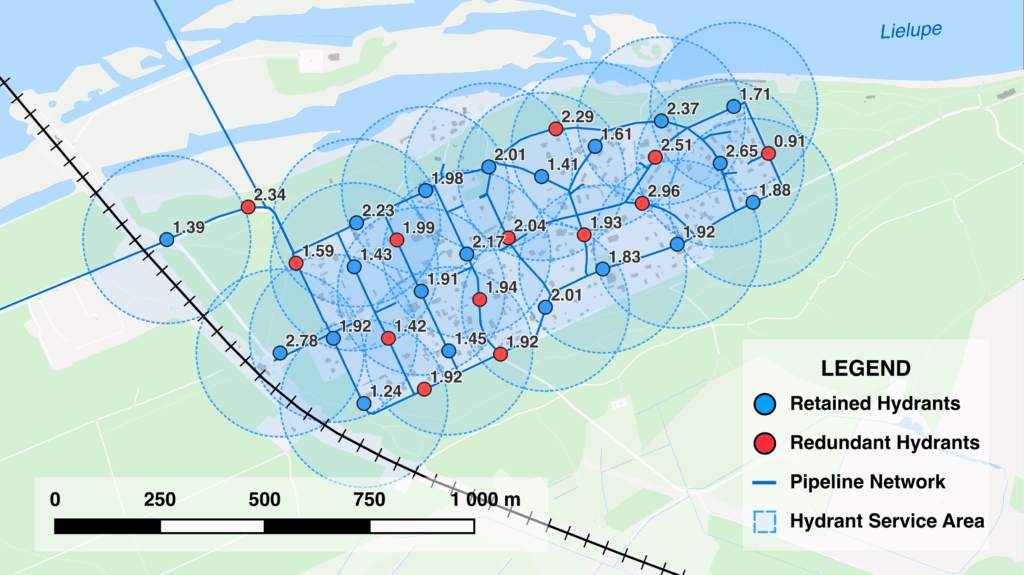
On paper, Jūrmala’s hydrant network looked highly resilient, averaging 7.1 hydrants per 200-meter service area—more than triple the regulatory requirement. From a firefighter’s perspective, this level of redundancy suggested robust fire safety coverage.
But in practice, the excess became a liability. Each hydrant carried recurring inspection and maintenance obligations, consuming crew capacity and driving up operational costs. Ironically, the very redundancy meant to support resilience actually eroded another core pillar of resilience—reliability—by diverting resources away from preventive maintenance, leak detection, and system upgrades.
This contradiction highlighted the need to move from object-driven resilience (more hydrants, greater safety) to objective-driven resilience (the right number of hydrants, in the right places, supporting both fire safety and operational reliability).
The Solution
Jūrmalas ūdens launched an in-house GIS program to test advanced decision-support workflows. Using ArcGIS Pro, ArcGIS Notebooks, and ArcGIS Field Maps, the utility designed a three-part framework:
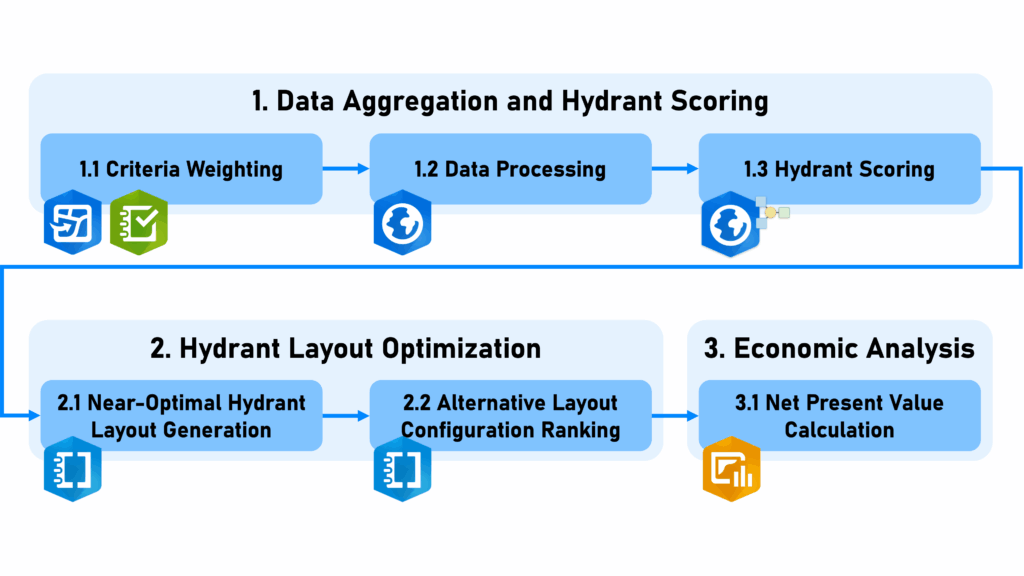
Data Aggregation and Hydrant Scoring
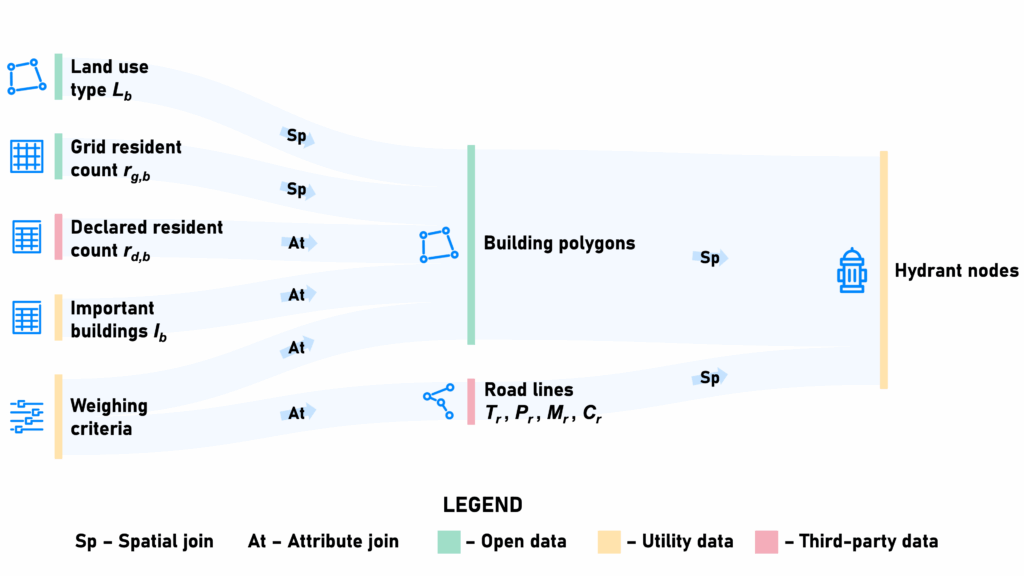
Hydrant data was combined with open datasets on building footprints, population density, land use, and road networks. A combination of geoprocessing tools available in ArcGIS Pro was then used to assign each hydrant a score based on its surroundings—including proximity to residents, access roads, and critical buildings.
Hydrant Layout Optimization
The optimization engine was entirely coded in ArcGIS Notebooks, where experts implemented a custom Python-based simulated annealing algorithm. Notebooks enabled rapid prototype creation, algorithm refinement, and repeatable model runs, accelerating the shift from manual map edits to automated decision-support workflows.
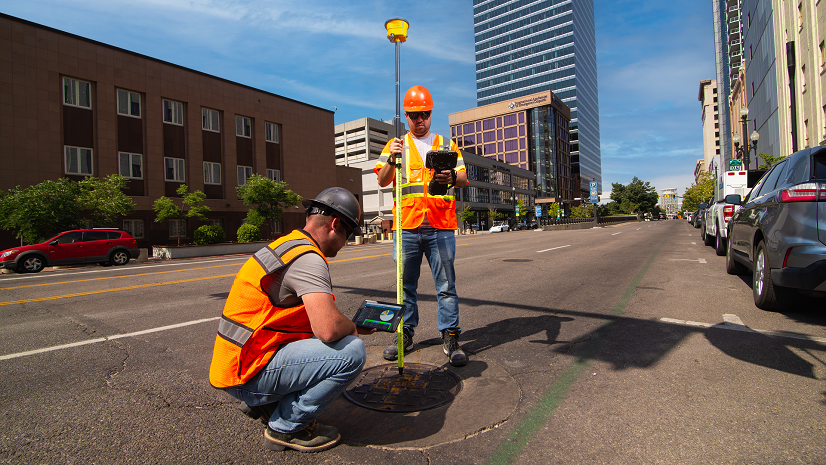
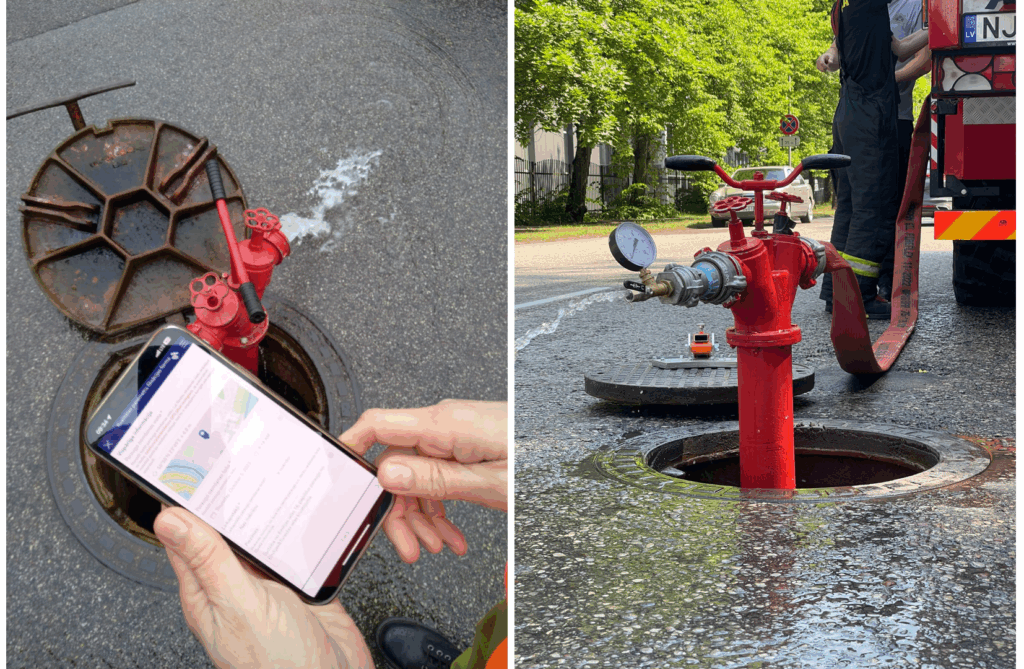
Inspection-Driven Validation
Field crews carried out hydrant inspections using ArcGIS Field Maps, capturing condition, accessibility, and operational data. This inspection data was then integrated into the optimization framework to ensure that only hydrants meeting both regulatory and operational criteria were considered for removal.
Economic Analysis
Long-term costs and benefits were assessed through a net present value (NPV) model—also developed in ArcGIS Notebooks—providing financial justification alongside operational efficiency.
The Results
The hydrant optimization pilot delivered measurable outcomes:
- 58 percent reduction in hydrants across test neighborhoods (from 344 down to 146), cutting redundant assets while maintaining full fire safety compliance
- Coverage maintained with average building-to-hydrant distance having increased modestly, from 54 meters to 76 meters—well within the 200-meter limit
When scaled to the full system, assuming a 40 percent reduction in hydrants, the outcomes were as follows:
- Annual savings: approximately €112,000 (roughly equal to 2 percent of utility operating expenses) and 995 crew hours freed up each year, equal to 120 workdays
- Long-term return on investment (ROI): A 30-year NPV gain of €0.8 million, with a 14-year break-even point
“By applying a GIS-driven framework, we turned hydrant management into a source of operational savings,” noted Gints Dakša, head of the GIS department at Jūrmalas ūdens. “This project proved GIS is more than a map—it’s a decision-support tool that shapes strategy.”
Why It Matters
For Jūrmalas ūdens, the project represents a leap in digital maturity and an affirmation of its CSU mission:
- Operational excellence: Resources once tied to redundant hydrant inspections can now be redirected to leak detection, network expansion, and climate resilience initiatives.
- Strategic agility: The same spatial-context approach can be applied to asset reliability, renewable energy siting, or water-loss management.
For the water sector, the project offers a proven, replicable model. By relying largely on open data and modular GIS tools, the framework is scalable to utilities of varying sizes and contexts. More importantly, it reframes redundancy management as a path to objective-driven resilience, showing that fewer assets—when strategically managed—can deliver both community safety and financial sustainability.

Stay Connected with Esri’s Water Team
ArcGIS is an extensive information system that enables modernization of workflows with easy-to-use applications for the field and office. Strengthen your organization with smart water solutions that will increase efficiency and provide insight for decision-makers.
Visit the Esri Water Utilities web site for more information.
Join the Water Utilities Community
Follow #EsriWater on social media: X| LinkedIn
Subscribe to the Water Industry newsletter “Esri News for Water Utilities and Water Resources“