Today is a beautiful day in Tennessee and I’m taking the opportunity to work from the porch. The bluebirds have come around to begin building their nests. I caught a raccoon on the security camera last night. Soon enough, my neighborhood texting group will start buzzing with sightings of the family of Geese that take up residence in the pond at the end of the road every year. My dogs sniff madly at the fence as the deer saunter by and munch on the neighbor’s landscaping.
For being in the heart of metro Nashville, we have a surprisingly great diversity of species that call the backyard home. It’s a reminder that my own home is one element in an extremely complex thread of interconnectedness with the natural world.
We can “doom scroll” articles on climate change and habitat destruction and feel like our ability to make a difference is impossible. However, I really don’t believe in that myth and want to take the opportunity today to look at a few examples of how we can use GIS to take meaningful action to both understand and protect our wildlife and the world we all depend on.
First Up – Understanding and Mitigating Issues
When I was a little girl growing up in “the sticks,” I’d stare out the back window of my parents’ car and wonder “How do the deer know to cross at the deer-crossing sign?” Spoiler alert: they didn’t! We all probably know intuitively those specific areas to keep an eye out for wildlife and slow down, but how do we capture that knowledge and use it to plan safer passage? With nearly $8 billion in damages a year and both human and wildlife lives at risk, it’s a problem that the Infrastructure Bill has set out to address. However, organizations have already begun to analyze these issues and in some creative ways with GIS!
Take for example the ROaDS Tool. Using ArcGIS Survey123, The ROaDS tool allows scientists, park rangers, concerned residents, law enforcement, nonprofit groups, and students to collect key information on roadkill observations that contribute to implementing solutions.
The Adventure Scientists, a non-profit organization, are about to hit over 11,000+ miles of cycling on roads in Montana and collecting data about roadkill! You can see their ArcGIS Dashboard here. I also really love their first-hand account detailed using an ArcGIS Story Map.
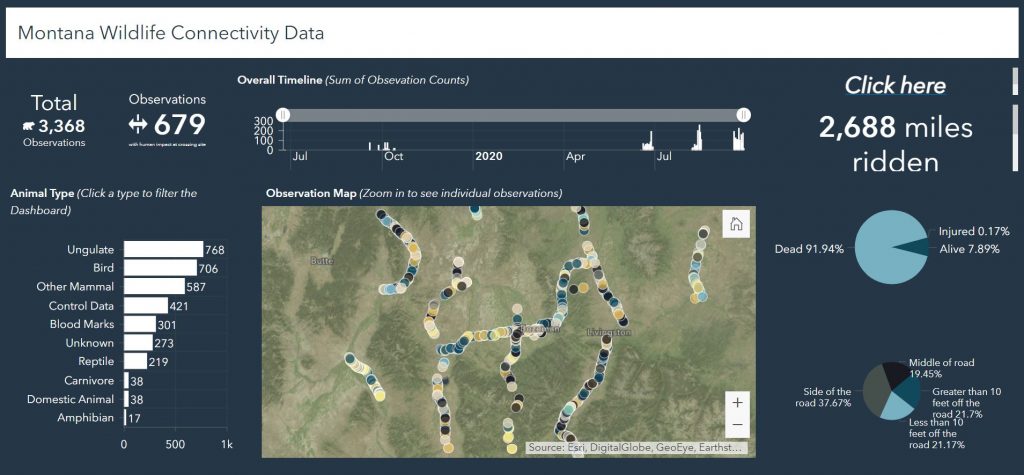
What I love about this story is that this is a BIG issue, but with localized action and some easy-to-use tools like ArcGIS Survey123 and Dashboards, they were able to understand where collisions were happening and how best to improve those wildlife corridors for safe passage for everyone.
Next Up – Empower Citizens to Take Local Action
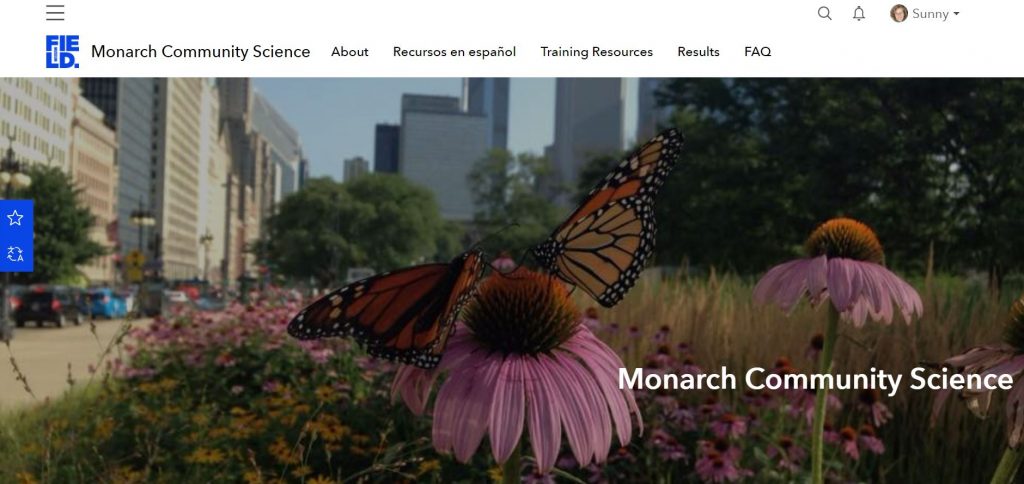
The Rights of Way as Habitat Working Group uses GIS to collaborate, coordinate and aggregate data on Monarch habitat so that land managers can make informed decisions on how best to restore corridors to support Monarch migration, habitat and by extension – other biodiversity! However – one of my favorite parts of this story involves the Chicago Field Museum’s Monarch Community Science Hub. They’re using ArcGIS Hub Premium to grow a group of community volunteers to monitor Monarch populations in their backyard milkweed patches. The Hub houses training videos, metrics on the research in real-time, and other tools that the citizen scientists need to both conduct the work but also see their impact! As a follower of the initiative, you receive emails throughout the year on updates and progress and can sign up to attend training events.
My own backyard wildlife has inspired me too! Spending more time at home, I was more aware of the impacts of how we steward are our small properties. Looking out on my backyard, I can see nearly 20 houses that line our valley, each with less than a ¼ acre. Collectively though, this is an urban wildlife corridor and we’re all responsible for our little patchwork of this larger landscape. With light pollution, pesticides and herbicides, invasive species, and other impacts of urban homeownership, I decided to deploy an ArcGIS Hub to spread awareness around one of my favorite wildlife phenomena: Lightning Bugs.
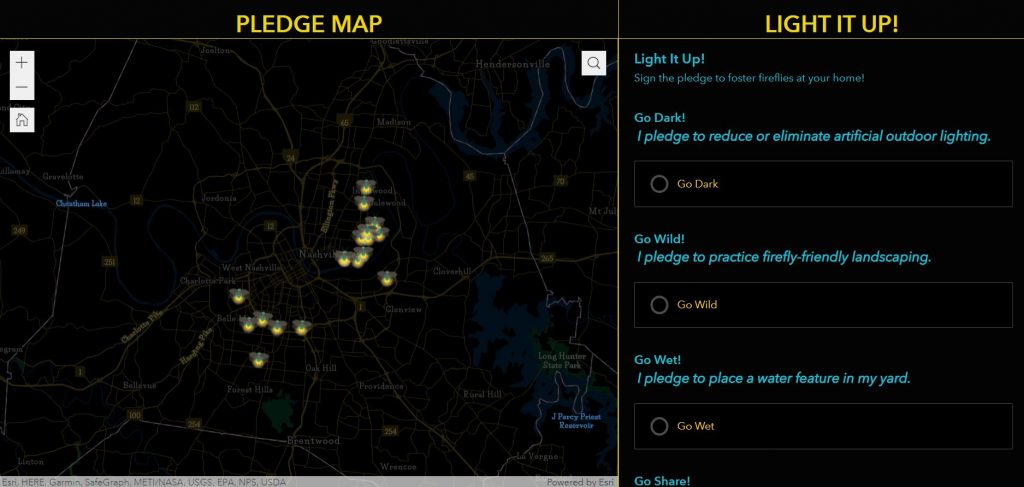
Using ArcGIS Hub, Story Maps, Survey123 and Dashboards, I was able to promote more environmentally-friendly practices that anyone can adopt and create a “pledge” for neighbors that would light up our map! The visual impact of seeing the Nashville map light up with our own “firefly corridor” was thrilling and gives me hope that with GIS, we all can make a difference today, tomorrow and for the future.
Happy World Wildlife Day!
To see more examples of how GIS is helping wildlife, visit our environmental and natural resources pages. And don’t forget to sign-up for our monthly eBrief!